Custom plots with mplot: Difference between revisions
Jump to navigation
Jump to search
Stefan Ritt (talk | contribs) (Created page with "{{Pagelinks}} = Introduciton = Custom pages may contain custom plots, sich as scatter plots, histograms and color plots. This can be achieved by including the <code>mplot.js...") |
Stefan Ritt (talk | contribs) m (→Introduciton) |
||
| Line 35: | Line 35: | ||
[[File:Simple plot.png]] | [[File:Simple plot.png]] | ||
The data is stored in the ODB under the X-array <code>/Path/To/Data/X</code> and the Y-array under <code>/Path/To/Data/Y</code> | The data is stored in the ODB under the X-array <code>/Path/To/Data/X</code> and the Y-array under <code>/Path/To/Data/Y</code> as two float arrays of the same size. | ||
= Optional parameters = | = Optional parameters = | ||
TBD | TBD | ||
Revision as of 19:16, 15 December 2023
Introduciton
Custom pages may contain custom plots, sich as scatter plots, histograms and color plots. This can be achieved by including the mplot.js library and creating a <div class="mplot"> element. Following example shows the code for a simple page for a scatter plot:
<!DOCTYPE html>
<html lang="en">
<head>
   <meta charset="UTF-8">
   <link rel="stylesheet" href="midas.css">
   <script src="controls.js"></script>
   <script src="midas.js"></script>
   <script src="mhttpd.js"></script>
   <script src="mplot.js"></script>
   <title>myPage</title>
</head>

<body class="mcss" onload="mhttpd_init('myPage');mplot_init()">
<div id="mheader"></div>
<div id="msidenav"></div>

<div id="mmain">
   <div class="mplot" style="height: 360px;width: 700px;"
        data-odb-path="/Path/To/Data"
        data-x="X" data-y="Y">
   </div>

</div>
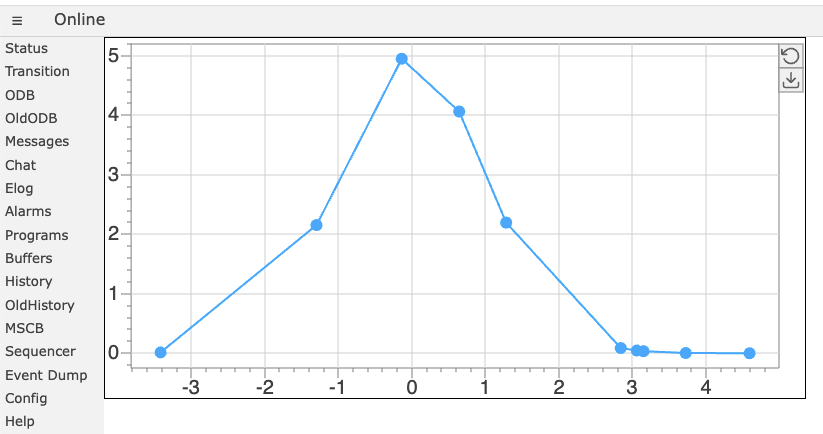
And here is the resulting page:
The data is stored in the ODB under the X-array /Path/To/Data/X and the Y-array under /Path/To/Data/Y as two float arrays of the same size.
Optional parameters
TBD
