Custom plots with mplot
Jump to navigation
Jump to search
Introduciton
Custom pages may contain custom plots, sich as scatter plots, histograms and color plots. This can be achieved by including the mplot.js library and creating a <div class="mplot"> element. Following example shows the code for a simple page for a scatter plot:
<!DOCTYPE html>
<html lang="en">
<head>
   <meta charset="UTF-8">
   <link rel="stylesheet" href="midas.css">
   <script src="controls.js"></script>
   <script src="midas.js"></script>
   <script src="mhttpd.js"></script>
   <script src="mplot.js"></script>
   <title>myPage</title>
</head>

<body class="mcss" onload="mhttpd_init('myPage');mplot_init()">
<div id="mheader"></div>
<div id="msidenav"></div>

<div id="mmain">
   <div class="mplot" style="height: 360px;width: 700px;"
        data-odb-path="/Path/To/Data"
        data-x="X" data-y="Y">
   </div>

</div>
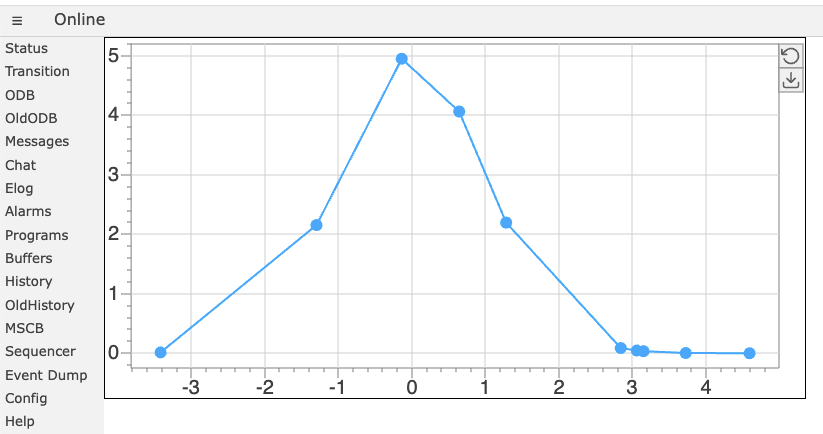
And here is the resulting page:
The data is stored in the ODB under the X-array /Path/To/Data/X and the Y-array under /Path/To/Data/Y
Optional parameters
TBD
