Custom plots with mplot
Introduciton
Custom pages may contain custom plots, sich as scatter plots, histograms and color plots. This can be achieved by including the mplot.js library and creating a <div class="mplot"> element. Following example shows the code for a simple page for a scatter plot:
<!DOCTYPE html>
<html lang="en">
<head>
   <meta charset="UTF-8">
   <link rel="stylesheet" href="midas.css">
   <script src="controls.js"></script>
   <script src="midas.js"></script>
   <script src="mhttpd.js"></script>
   <script src="mplot.js"></script>
   <title>myPage</title>
</head>

<body class="mcss" onload="mhttpd_init('myPage');mplot_init()">
<div id="mheader"></div>
<div id="msidenav"></div>

<div id="mmain">
   <div class="mplot" style="height: 360px;width: 700px;"
        data-odb-path="/Path/To/Data"
        data-x="X" data-y="Y">
   </div>

</div>
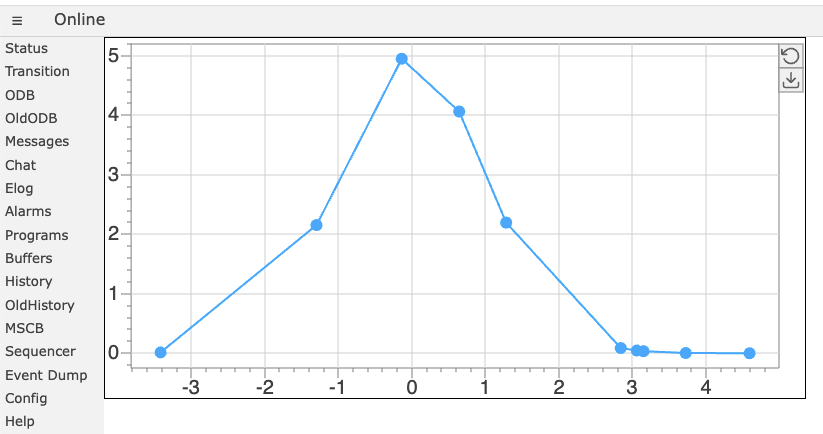
And here is the resulting page:
The data is stored in the ODB under the X-array /Path/To/Data/X and the Y-array under /Path/To/Data/Y as two float arrays of the same size.
Optional parameters
Several options are possible to modify the plot. Following table gives an overview of the various parameters:
| Parameter | Meaning |
|---|---|
| data-odb-path | Path into the ODB where the data for the plot is stored |
| data-x | X data for the first graph |
| data-y | Y data for the first graph |
| data-x1 | X data for the first graph if several graphs are used |
| data-y1 | Y data for the first graph if several graphs are used |
| data-x<n> | X data for the <n>-th graph if several graphs are used |
| data-y<n> | Y data for the <n>-th graph if several graphs are used |
| data-h | Y data for a histogram |
| data-xy | Data for a color map. The array must have the dimension n*m with n, m the dimensions in x and y of the color map |
| data-title | Title of the graph shown on top |
| data-x-text | Label shown below the X-axis |
| data-y-text | Label shown left of the Y-axis |
| data-x-min | Minimum of the X-axis |
| data-x-max | Maximum of the X-axis |
| data-y-min | Minimum of the Y-axis |
| data-y-max | Maximum of the Y-axis |
| data-x-min | Minimum of the Z-axis (color axis for color maps) |
| data-x-max | Maximum of the Z-axis |
| data-overlay | Function which gets called after the graph has been drawn. The function can be used to draw an overlay on the graph. See below for an example. |
Overlay function
The overlay function can be used to draw text or graphics on top of the graph. Following function puts a label at the graph:
   function overlay(plot, ctx) {
      ctx.fillStyle = "red";
      plot.drawTextBox(ctx, "First overlay line\nSecond overlay line", 120, 150);
   }
JSON parameter set
Instead of defining all parameters with data-xxx tags, the parameters might be defined inside the
<div class="mplot" style="height: 400px;width: 700px;">
{
   "showMenuButtons": true,

   "color": {
      "background": "#FFFFFF",
      "axis": "#808080",
      "grid": "#D0D0D0",
      "label": "#404040"
   },

   "title": {
      "color": "#404040",
      "backgroundColor": "#808080",
      "textSize": 20,
      "text": "Customized scatter plot"
   },

   "legend": {
      "show": true,
      "color": "#D0D0D0",
      "backgroundColor": "#FFFFFF",
      "textColor": "#404040",
      "textSize": 16
   },

   "xAxis": {
      "log": false,
      "min": -10,
      "max": 10,
      "grid": true,
      "textSize": 10,
      "title": {
         "text": "x [mm]",
         "textSize" : 14
      }
   },

   "yAxis": {
      "log": false,
      "min": -10,
      "max": 10,
      "grid": true,
      "textSize": 10,
      "title": {
         "text": "Scaler [Hz]",
         "textSize" : 10
      }
   },

   "plot": [
      {
         "type": "scatter",
         "odbPath": "/System/Tmp/Plot",
         "x": "X2",
         "y": "Y2",
         "label": "High threshold",
         "marker": {
            "draw": true,
            "lineColor": 3,
            "fillColor": 3,
            "style": "cross",
            "size": 10,
            "lineWidth": 2
         },

         "line": {
            "draw": false,
            "fill": true,
            "color": 0,
            "style": "solid",
            "width": 1
         }
      }
   ]

}
</div>
The parameter list does not have to be complete. Any existing parameter in this list is combined with the internal default parameter set. The colors might be either a direct color like "red" or "#FF0000", or an index to the list of 16 internal colors, which have to be chosen to be as far apart as possible in color space.
