Custom plots with mplot
Introduciton
Custom pages may contain custom plots, sich as scatter plots, histograms and color plots. This can be achieved by including the mplot.js library and creating a <div class="mplot"> element. Following example shows the code for a simple page for a scatter plot:
<!DOCTYPE html>
<html lang="en">
<head>
   <meta charset="UTF-8">
   <link rel="stylesheet" href="midas.css">
   <script src="controls.js"></script>
   <script src="midas.js"></script>
   <script src="mhttpd.js"></script>
   <script src="mplot.js"></script>
   <title>myPage</title>
</head>

<body class="mcss" onload="mhttpd_init('myPage');mplot_init()">
<div id="mheader"></div>
<div id="msidenav"></div>

<div id="mmain">
   <div class="mplot" style="height: 360px;width: 700px;"
        data-odb-path="/Path/To/Data"
        data-x="X" data-y="Y">
   </div>

</div>
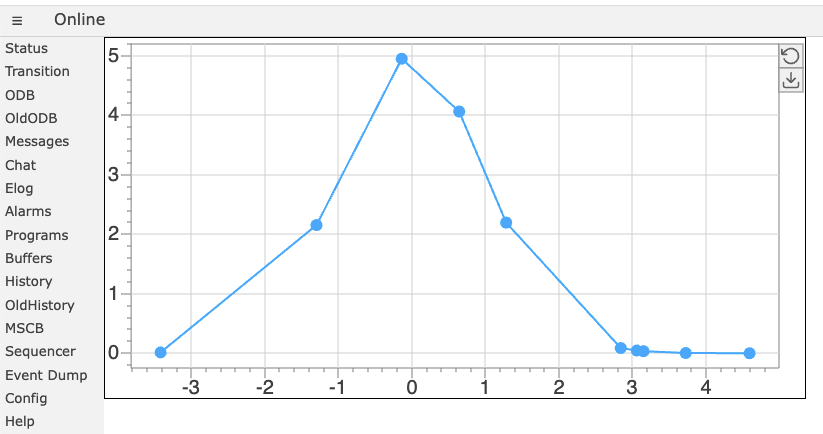
And here is the resulting page:
The data is stored in the ODB under the X-array /Path/To/Data/X and the Y-array under /Path/To/Data/Y as two float arrays of the same size.
Optional parameters
Several options are possible to modify the plot. Following table gives an overview of the various parameters:
| Parameter | Applies to | Meaning |
|---|---|---|
| data-odb-path | All plot types | Path into the ODB where the data for the plot is stored |
| data-x | scatter, histogram | ODB path to X data for the first graph (relative to data-odb-path) |
| data-y | scatter | ODB path to Y data for the first graph (relative to data-odb-path) |
| data-x1 | scatter, histogram | ODB path to X data for the first graph if several graphs are used (relative to data-odb-path) |
| data-y1 | scatter | ODB path to Y data for the first graph if several graphs are used (relative to data-odb-path) |
| data-x<n> | scatter, histogram | ODB path to X data for the <n>-th graph if several graphs are used (relative to data-odb-path) |
| data-y<n> | scatter | ODB path to Y data for the <n>-th graph if several graphs are used (relative to data-odb-path) |
| data-h | histogram | ODB path to Y data for a histogram (relative to data-odb-path) |
| data-h<n> | histogram | ODB path to Y data for the <n>-th histogram if several histograms are used (relative to data-odb-path) |
| data-label<n> | scatter, histogram | Label for <n>-th graph or histogram if several are used |
| data-alpha<n> | scatter, histogram | Transparency (alpha) for graph or histogram if several are used. 0 is completely transparent and 1 is opaque. |
| data-nx | colormap | Number of X bins for a color map. |
| data-ny | colormap | Number of Y bins for a color map. |
| data-z | colormap | ODB path to data for a color map (relative to data-odb-path). If data-nx is 3, and data-ny is 4, then data-z must be 12 elements long (one entry for each x,y co-ordinate). Ordering is "loop through all X indices for the lowest Y index before moving to next Y index", e.g. (0,0), (1,0), (2,0), (1,0), (1,1) .... (3,0), (3,1), (3,2). |
| data-title | All plot types | Title of the graph shown on top |
| data-x-text | All plot types | Label shown below the X-axis |
| data-y-text | All plot types | Label shown left of the Y-axis |
| data-x-min | scatter, histogram | Minimum of the X-axis |
| data-x-max | scatter, histogram | Maximum of the X-axis |
| data-x-log | scatter, histogram | Use logarithmic X-axis if "true" |
| data-y-min | scatter, histogram | Minimum of the Y-axis |
| data-y-max | scatter, histogram | Maximum of the Y-axis |
| data-y-log | scatter, histogram | Use logarithmic Y-axis if "true" |
| data-z-min | colormap | Minimum of the Z-axis (color axis for color maps) |
| data-z-max | colormap | Maximum of the Z-axis |
| data-overlay | All plot types | Function which gets called after the graph has been drawn. The function can be used to draw an overlay on the graph. See below for an example. |
Overlay function
The overlay function can be used to draw text or graphics on top of the graph. Following function puts a label at the graph:
   function overlay(plot, ctx) {
      ctx.fillStyle = "red";
      plot.drawTextBox(ctx, "First overlay line\nSecond overlay line", 120, 150);
   }
JSON parameter set
Instead of defining all parameters with data-xxx tags, the parameters might be defined inside the <div> tag using JSON encoding. Following text gives a complete example of all parameters:
<div class="mplot" style="height: 400px;width: 700px;">
{
   "showMenuButtons": true,

   "color": {
      "background": "#FFFFFF",
      "axis": "#808080",
      "grid": "#D0D0D0",
      "label": "#404040"
   },

   "title": {
      "color": "#404040",
      "backgroundColor": "#808080",
      "textSize": 20,
      "text": "Customized scatter plot"
   },

   "legend": {
      "show": true,
      "color": "#D0D0D0",
      "backgroundColor": "#FFFFFF",
      "textColor": "#404040",
      "textSize": 16
   },

   "xAxis": {
      "log": false,
      "min": -10,
      "max": 10,
      "grid": true,
      "textSize": 10,
      "title": {
         "text": "x [mm]",
         "textSize" : 14
      }
   },

   "yAxis": {
      "log": false,
      "min": -10,
      "max": 10,
      "grid": true,
      "textSize": 10,
      "title": {
         "text": "Scaler [Hz]",
         "textSize" : 10
      }
   },

   "plot": [
      {
         "type": "scatter",
         "getFromODB": true,
         "odbPath": "/System/Tmp/Plot",
         "x": "X2",
         "y": "Y2",
         "label": "High threshold",
         "marker": {
            "draw": true,
            "lineColor": 3,
            "fillColor": 3,
            "style": "cross",
            "size": 10,
            "lineWidth": 2
         },

         "line": {
            "draw": false,
            "fill": true,
            "color": 0,
            "style": "solid",
            "width": 1
         }
      }
   ]

}
</div>
The parameter list does not have to be complete. Any existing parameter in this list is combined with the internal default parameter set. The colors might be either a direct color like "red" or "#FF0000", or an index to the list of 16 internal colors, which have to be chosen to be as far apart as possible in color space.
More examples
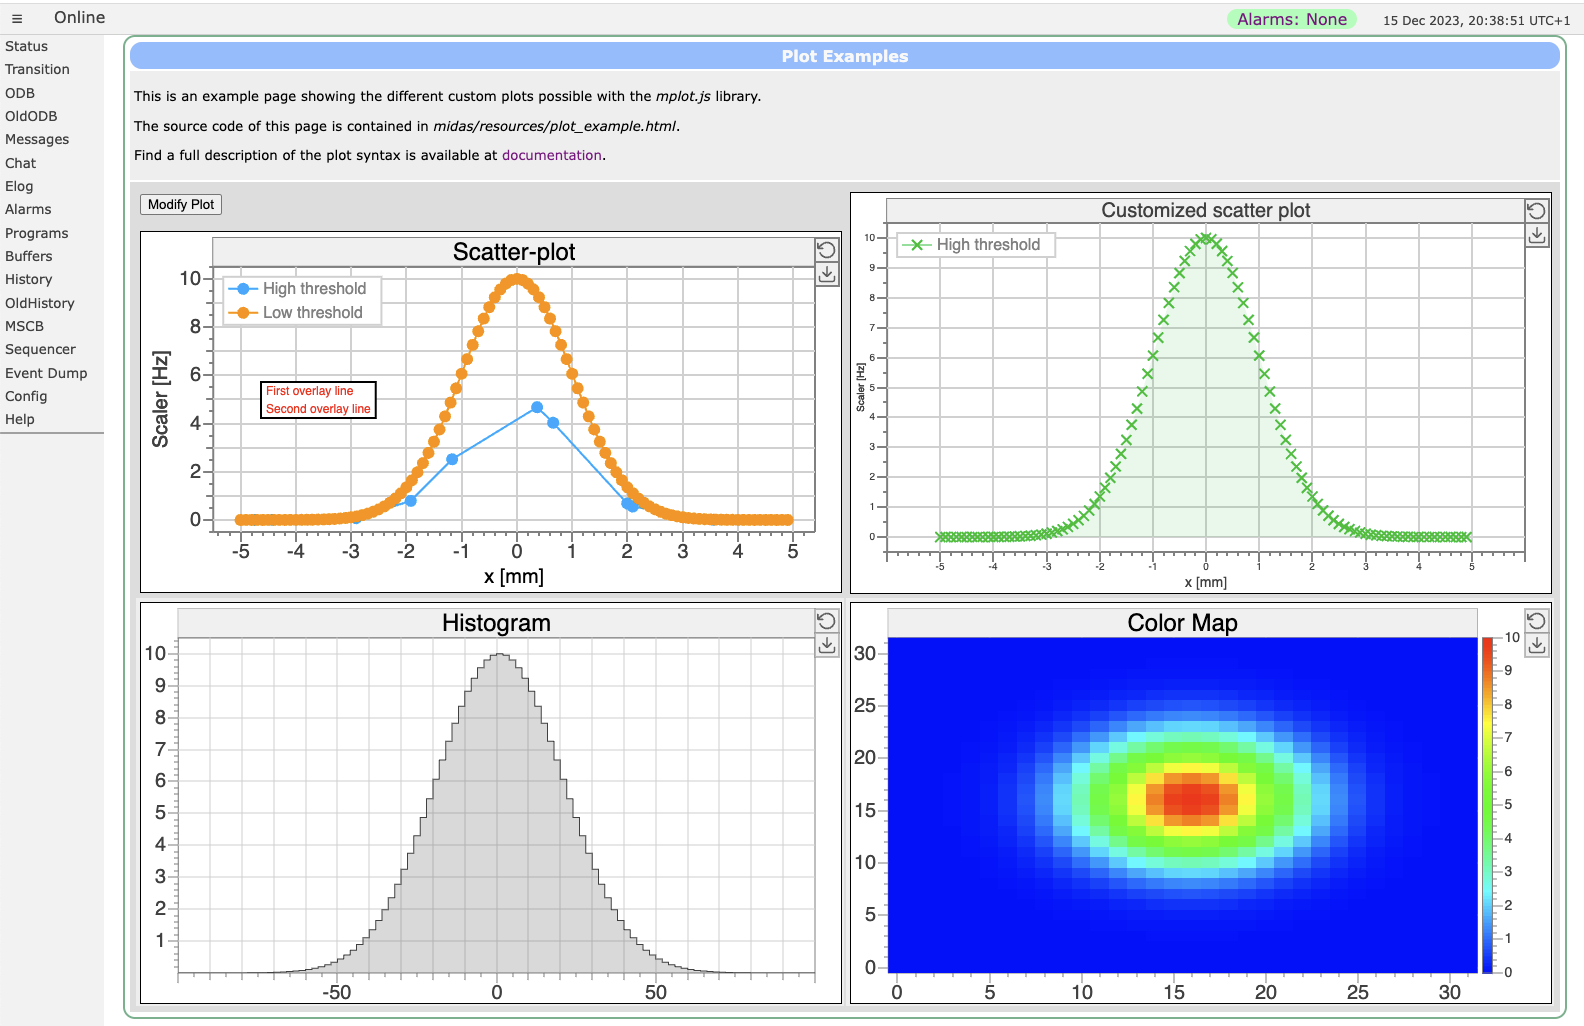
More plot examples are contained in the plot_example.html file in the midas/resource/ directory which produces following page:
Setting parameters and data programmatically
To set the parameters of a plot via JavaScript code, simply access the plot object and modify its parameters like
  let p = document.getElementById("MyPlot").mpg;    // obtain plot from ID
  p.param.title.text = "Different titel";           // change plot title
  p.param.plot[0].line.color = 2;                   // change line color of first plot to index 2
To change the data of the plot, use the function setData(index, x, y) for scatter plots or setData(index, h) for histograms like
  let p = document.getElementById("MyPlot").mpg;    // obtain plot from ID
  let x = Array.from({length: 20}, (_, i) => i);    // create x array with 20 elements 0,1,2,...19
  let y = x.map(x => x*x);                          // create y array with y_i = x_i^2
  p.setData(0, x, y);
To create a plot directly from JavaScript code without a <div class="mplot" ...> HTML element, directly use the MPlotGraph() constructor as
   let plot = new MPlotGraph(document.getElementById("plotId"));
   plot.setData(0, x, y)
A set of parameters can be passed to the constructor. This allows to create plots other than a scatter plot with different parameters such as:
   // create colormap plot with parameters
   let param = {
      type = "colormap";
      showZScale: true,
      nx: 32,
      ny: 32,
      xMin : -20,
      xMax: 20,
      yMin: -10,
      yMax: 10
   };
   let plot = new MPlotGraph(document.getElementById("plotId"), param);

   // create some dummy data
   let size = 32;
   let z = Array.from({length: size*size});
   for (let y=0 ; y<size ; y++)
      for (let x=0 ; x<size ; x++) {
         z[y*size + x] = 10 * Math.exp(-(x-size/2)*(x-size/2) / size) *
            Math.exp(-(y-size/2)*(y-size/2) / size );
      }

   // display dummy data
   plot.setData(0, z)

