Status Page
Links
Purpose
The purpose of the mhttpd main status page is to allow the user to control and monitor the experiment.
Access the status page
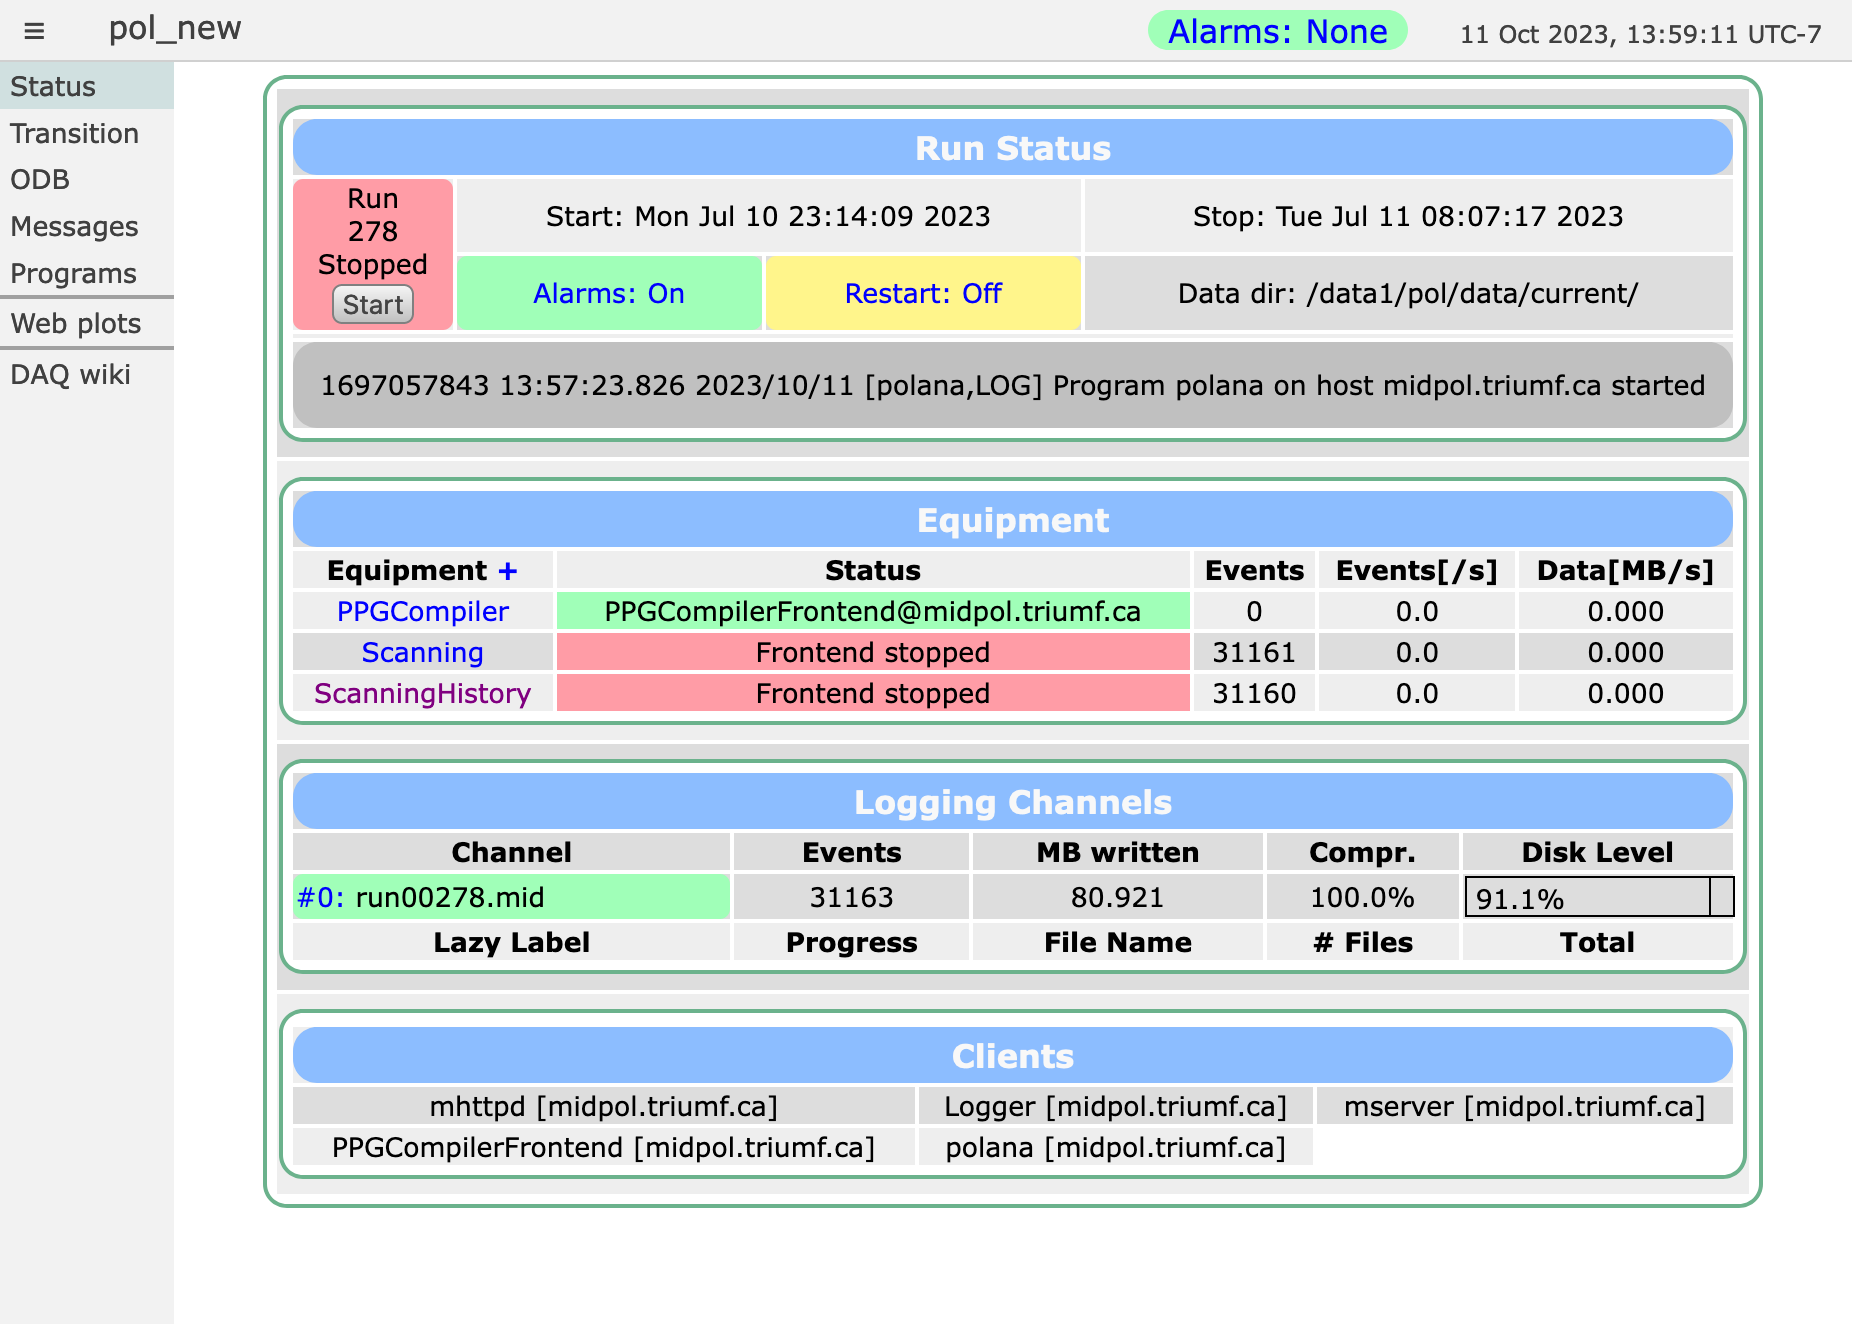
To connect to the MIDAS web server mhttpd main status page for an experiment see Usage. An example of the status page is shown below. Note that it is possible for the user to set up web access restrictions to the experiment (see Security).
Page Refresh
It is important to note that the refresh of the Status Page is not "event driven" but is controlled by a timer whose rate is adjustable through the Config button. This means the information at any given time may reflect the experiment state of up to n seconds in the past, where n is the timer setting of the refresh parameter.
Features of the status page
The status page is divided into several parts
- Menu Buttons
- Run Control buttons
- Page Switch Buttons
- Optional (user-defined) buttons
- Run Status information
- Optional display of status items
- Optional Run Description and Comment
- Last system message
- Equipment Information and Event rates
- Data Logging Information
- Active client list
Example Status Page
Menu Buttons
The top row of Menu buttons on the main status page include the run control buttons (Start/Stop/Pause/Resume depending on the run state) and the page switch buttons (e.g. Messages, Elog, Alarms, Programs, History, Sequencer, MSCB, Help). Clicking on a page switch button will replace the Status page with the requested page. All the pages contain a Status button to return to the Status page. The ODB button allows the user to access and edit the ODB and the Config button allows the Status page refresh time to be changed.
Not all the available buttons may be visible on the main status page. For example, the MSCB button will only be visible if MSCB support has been built into Midas. Keys in the /Experiment ODB tree controls which menu buttons are visible on the status page. The user may change these as required. The Menu Buttons key lists the buttons to appear on the page. The Start/Stop buttons and Pause/Resume buttons may be suppressed using the Start-Stop Buttons and Pause-Resume Buttons keys respectively.
Optional Buttons
Below the Menu Buttons, there may be up to three rows of optional user-added buttons. These may include
If a frontend contains a manually-triggered event, this will cause a button to be created on the status page that when pressed, will trigger that event.
In the example, test is a script-button, ppg-cycle is a custom-button, the other buttons on the line are all alias-buttons.
Run Status Information
The run status information displays important information, such as the run status, alarm system status and data directory. The run may also be started/stopped using the button provided. The colour or information changes depending whether the run is active or not (e.g. run elapsed time or run stop time). By default, the experiment name is also shown here. The user may choose to display other useful information in this area (see Status items.
The last item in this area is a one-line display of the last Midas message. More messages can be viewed on the Message page.
Equipment Information
This area shows the status (by colour) of any defined Equipments (unless hidden). Green means active, red stopped and yellow disabled. The names of the equipments are links to the /Equipment/<equipment-name>/Variables subtree. If the Equipment sends data to the ODB (see Log History and RO_ODB flag), clicking on this link will display the contents of the /Equipment/<equipment-name>/Variables subtree with the name of each variable if the <Names subtree has been set up (see example).
