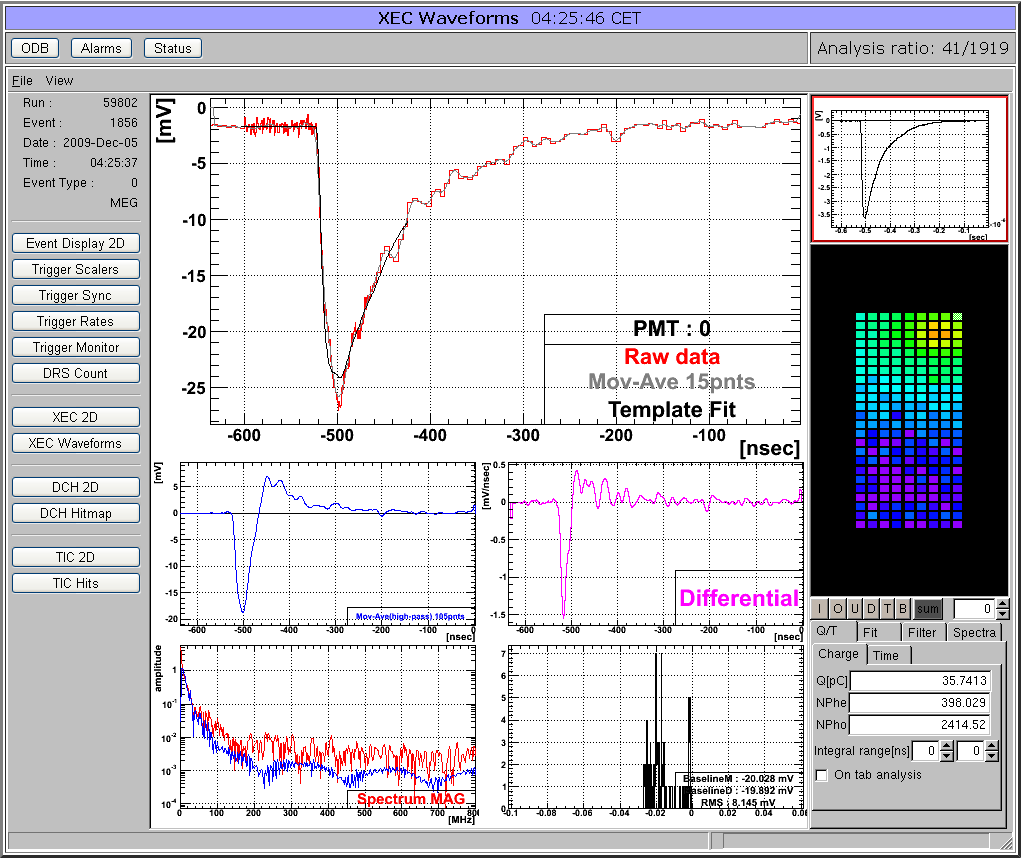
Many midas experiments work with ROOT based analyzers today. One problem there is that the graphical output of the root analyzer can only be seen through the X server and not through the web. At the MEG experiment, we solved this problem in an elegant way: The ROOT analyzer runs in the background, using a "virtual" X server called Xvfb. It plots its output (several panels) normally using this X server, then saves this panels every ten seconds into GIF files. These GIF files are then served through mhttpd using a custom page. The output looks like this:

The buttons on the left sides are actually HTML buttons on that custom page overlaid to the GIF image, which in this case shows one of our 800 PMT channels digitized at 1.6 GSPS. With these buttons one can cycle through the different GIF images, which then automatically update ever ten seconds. Of course it is not possible to feed interaction back to the analyzer (like the waveform cannot be fitted interactively) but for monitoring an experiment in production mode this tools is extremely helpful, since it is seamlessly integrated into mhttpd. All the magic is done with JavaScript, and the buttons are overlaid to the graphics using CSS with absolute positioning. The analysis ratio on the top right is also done with JavaScript pulling the right info out of the ODB.
The used custom page file is attached. For details using Xvfb server, please contact Ryu Sawada <sawada@icepp.s.u-tokyo.ac.jp>. |