Detector Calibration
Back to Main Page
Table of Figures
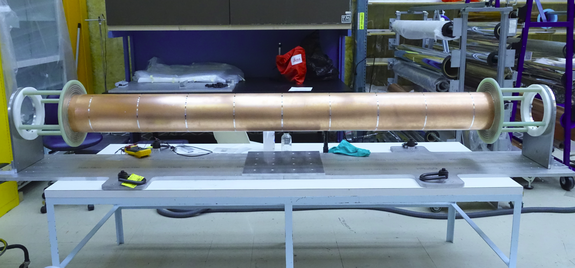
Figure 2 - Inner cylinder with copper cathode and Aluminum strips 6
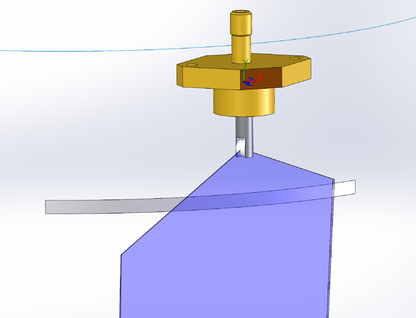
Figure 3 - Optical head assembly to be mounted on the endplate 6
Figure 5 - Pulse height vs pad row from prototype
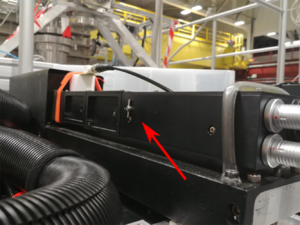
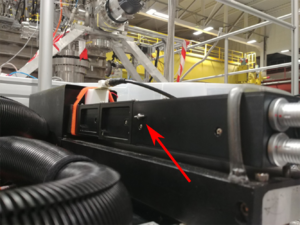
Figure 6 - Laser shutter positions
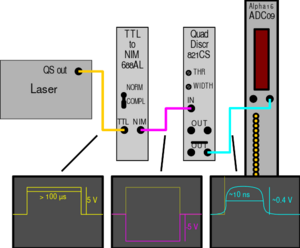
Figure 9 - Laser trigger setup
Figure 10 - UBC setup for laser test
Figure 11 - Schematic of the UBC test configuration
Figure 12 - Photoemission versus incident angle for Aluminum
Figure 13 - Ratio of electron per photon versus incident angle for different base material
Purpose
The calibration system for the ALPHA-g rTPC is to provide a reference measurement of the electron drift direction and speed for a known configuration. These parameters are subject to environmental changes (pressure, temperature, gas mixture) as well as external drift voltage and magnetic field.
Method
For comparing to a reference measurement, a consistent number of primary electrons at a defined geometrical location are required. Two methods have been considered.
- Alpha source (Am241) mounted on the central cathode surface. This technique is well understood and working well in particular for a long drift detector. The emission rate from the calibration source can be adjusted but cannot be controlled. In our case, the impact of the calibration event rate on the overall physics trigger rates is to be considered as once the source are installed, the emission cannot be stopped.
- Laser beam striking aluminized surface on the central cathode to achieve electron emission. This technique has been used for the T2K TPC detector with success. The work function of the aluminum being lower than the one of copper, an increase of electron emission from the aluminum will be distinguishable relative to the copper. In our case cathode surface is copper with aluminum strips at known locations. Therefore it is possible to “image” the aluminum positions from the emitted drifting electrons to the anodes. The intended laser wavelength is to be the same as in T2K (Nd:YAG frequency-quadrupled to 266nm).
The laser method with its external trigger capability and better defined electron emission has been deemed the preferred solution.
References
- Elog entry and pdf document: Laser test results by Lars Martin
- File:Brio ICE450 Power Supply Manual.pdf
- File:Full Laser System Short Manual.pdf
- File:LaserSpecs.pdf
Concept
The top and bottom endplates have provisions for inserting the necessary optic module to deliver a laser plane intersecting the inner cathode cylinder. The initial laser beam in the order of 0.5mm in diameter is converted into a plane through a transparent cylindrical quartz rod of 5mm diameter within the detector volume. The plane has an aperture angle in the order of 90deg illuminating both sides of the drift path. Aluminum strips on pre-defined locations along the inner cathode will emit electrons when struck by the 266nm laser light. Using a triggered pulse laser source, the electron arrival on the anode wire and the induced charge on the cathode pads along the anode wire will provide the timing and Z position of the intersection point of the aluminum strip and the laser plane. The light plane is slightly rotated and tilted off the z-axis in order separate the Al strip electron cloud from reaching all the same wires. For the given rotation and tilt angles (45deg, 1deg) we have spaced the Al strips such that 2 anode wires will be separating the 2 electron clouds of two consecutive Al strips.
Figure 1 – rTPC cross-section with at the bottom the central cathode with Al strips. A laser plane illuminates the central cathode for electron production.
Mechanical design
The mechanical modification to the endplate for the laser calibration option is minimal. They consist in:
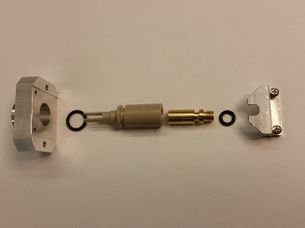
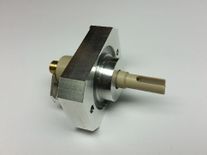
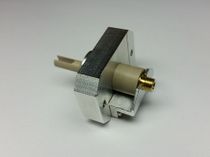
- Placing 2 laser access holes in each endplate, giving us the option to feed 4 laser optic modules to the rTPC, see Figure 3. The advantage of multiple access points is to better cover the whole drift volume and to illuminate both ends of the detector with similar incident angles.
- Additional 9 Aluminum strips of 6mm width wrapped around the inner cylinder at 9 locations see Figure 7. Table 1 list the position of the 9 strips, the final column shows the phi coordinate at which the laser light hits the given strip for one possible set of geometric parameters of the optics package.
| Strip number | Nominal z [mm] | Laser phi in degrees |
|---|---|---|
| 0 | -1060 | -17.647 |
| 1 | -795 | -7.450 |
| 2 | -530 | 0.447 |
| 3 | -265 | 7.225 |
| 4 | 0 | 13.328 |
| 5 | 265 | 18.978 |
| 6 | 530 | 24.310 |
| 7 | 795 | 29.412 |
| 8 | 1060 | 34.348 |
Table 1 - Al strip position
Figure 2 - Inner cylinder with copper cathode and Aluminum strips
|
|
Figure 4 - Model of the laser equipment at the endplate with light simulated plane on first Aluminum strip.
Specifications
| Parameter | Value |
|---|---|
| Laser Pulsed beam | 0..100Hz triggerable |
| Wavelength | 266 nm |
| Power | 2uW |
| Pulse Energy | 2.6mJ |
| Pulse Width | 8.8ns |
| Near Field Beam Diameter | 1.7mm |
| Divergence at 86.5% | 1.8mrad |
| Aluminum strip width | 6mm |
| Aluminum strip length | Full circumference |
| Aluminum strip pitch in the z-direction | 265mm |
| Number of Aluminum strips | 9 |
| Aperture angle | 90 deg |
| Tilt angle | 1 deg |
| Rotation angle | 45 deg |
Tests of the laser calibration system using the prototype show a clear pattern of the Al strips. Analysis of the pattern reproduces the strip position with good accuracy. Despite the strip pitch in the prototype being much tighter at 40mm instead of 265mm the peaks are very clearly separated in the z-pads. The amplitude variation between peaks is due to the laser intensity distribution which has not been investigated in detail. It is not a high priority because the laser system is not meant for pulse height calibration, but rather for time and position.
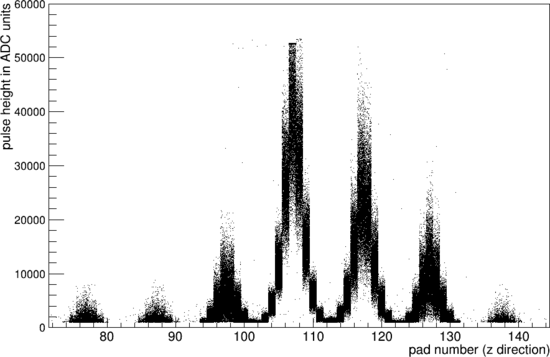 Figure 5 - Pulse height vs pad row from prototype
The laser plane is not inclined in the prototype, so a separation on the anode wires is impossible. The wider spacing for the final detector was chosen to allow for a good separation in the anodes.
As mentioned above the laser intensity distribution is not well understood yet, but we are confident we can illuminate the 4-5 strips closest to each laser port. The combination of shallow incidence angle and low geometric efficiency makes it questionable whether enough light can reach the far end of the TPC. It may be possible to increase the laser intensity to reach further strips at the expense of saturating the signals in the intensity maximum.
Operation
Physical safety measures and Interlock
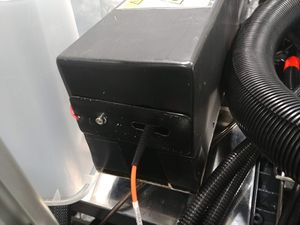
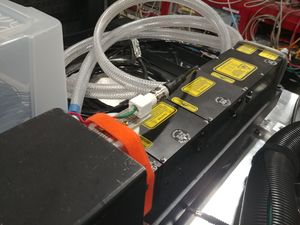
The laser is equipped with a physical shutter, that prevents laser light from coming out even if the laser is firing. Ensure the shutter is closed before disconnecting fiber. Ensure it's open when trying to operate.
Figure 6 - Laser shutter positions
The interlock ensures the laser is enclosed before operating. In order to satisfy it the fiber cover has to be screwed on and the entire enclosing box has to be screwed down.
Figure 7 - Interlock cabling
Manual operation / Switching on
The laser gets turned on with the key at the front of the power supply unit. After turning on it may take a while (~5min) to warm up the cooling water (interlock message is displayed on the handheld control unit). Other interlock messages indicate something is wrong.
Once the system is started up it can be operated from the handheld control unit, by pressing first the flash start, then after a mandatory waiting period the QS start buttons. This manual operatio should not be necessary.
Midas operation
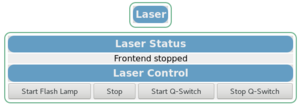
The Midas laser page mirrors the important parts of the manual control. In order to use it the feLaser frontend must be running. To start firing the laser, press the "Start flash lamp" button, then wait until the status line shows "flash", then press "Start Q-Switch". Pausing the laser briefly can be done by just stopping the Q-Switch, for longer breaks turn off the flash lamp. (Turning off the flash lamp automatically turns off the Q-Switch, so there is no need to turn it off manually.
Figure 8 - MIDAS laser page
Trigger setup
The laser outputs a positive 5V TTL signal of a considerable length, while the Alpha16 NIM trigger requires an inverted NIM-type signal, i.e. +500mV or so, nanoseconds to tens of nanoseconds in length. We found that the TTL-NIM converter actually only inverts the TTL signal (when switched to COMPL), without changing the length, while a simple NIM discriminator only works on a negative analog signal, not the positive TTL. So the TTL gets inverted by the TTL-NIM, that inverted signal then goes into a discriminator, creating a short NIM-like pulse. Using the complement output gives us the positive instead of negative pulse. (DC offsets should not affect these electronics too much.)
A previous attempt resulted in cryptic error messages from the laser, as apparently the discriminator fed some sort of signal back into the laser QS-out. This arrangement seems to avoid that.
Figure 9 - Laser trigger setup
Troubleshooting
| Problem | Possible solution |
|---|---|
| feLaser doesn't start | Check messages if both ICE450 and MVAT were found, if not check USB-serial connections |
| If everything seems connected, on the handheld control unit, navigate to System and switch Serial Link on | |
| BNC interlock | Make sure laser enclosure and fiber cover are screwed down correctly. |
| Laser shows PSU error | Disconnect cable from QS out, if error goes away, re-think/re-build trigger system |
| Other interlocks / errors | Refer to manual File:Brio ICE450 Power Supply Manual.pdf |
| DAQ doesn't trigger | Confirm NIM mask is correct in ODB, and TrigEsataNimGrandOr is selected as trigger source (DAQ manual) |
| DAQ shows low rate | Try adjusting pulse width on discriminator |
| DAQ shows double rate (100Hz instead of 50Hz) | Try increasing threshold on discriminator |
Appendix I – Bench tests
To reproduce the T2K laser calibration configuration in the Alpha-g rTPC, it would require shining the laser normal to the inner cathode surface. While the drift region is about 1m long for T2K, it is about 5cm in the Alpha-g. In addition the outer surface of the rTPC is fully occupied with the cathode pad readout electronics boards preventing any acceptable insertion of laser light direction normal to the tangent of its surface.
The remaining possible solution for the Alpha-g laser calibration is to shine the laser from its endplates. There the space is also quite restricted but available. In this configuration see Figure 1, the incident light angle varies from about 45 deg to less than 1deg due to the rTPC geometrical proportions. The electron emission efficiency at these incident angles varies substantially.
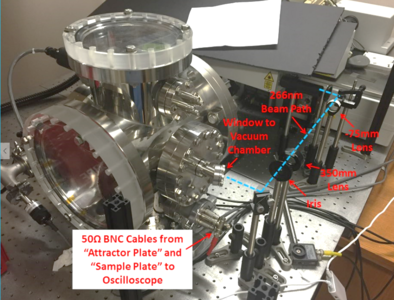
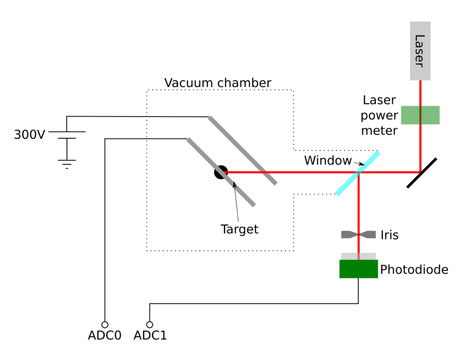
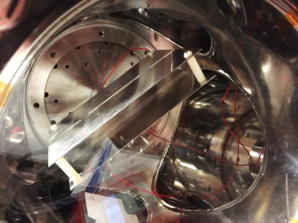
The shallow angle of the laser light on the central cathode cylinder is a concern for the electron emission efficiency. In order to quantify the parameter for the laser source specification, we have gone through multiple tests at UBC where a vacuum chamber with a 266nm laser was available. A dedicated mounting setup within the vacuum chamber permitted to rotate a plane holding our material sample, see Figure 2. The setup consisted in a double plate “capacitor-like” configuration, with one of the electrodes holding the sample and the other collecting the emitted electrons, see Figure 3. The signal was then collected through a dedicated DAQ for signal charge analysis versus incident angle on different material.
|
Figure 10 - UBC setup for laser test |
|
Figure 11 - Schematic of the UBC test configuration
The Aluminum and copper have different “work function” values. The results from T2K showed electron extraction from the aluminum to be about 2 pe/mm2 while for copper around 0.03 pe/mm2. This ratio of 70 provides the necessary contrast for strip localization and therefore local drift time calibration. Similar tests at UBC were set up to possibly confirm these numbers. In addition the work function values found in literature fluctuate sufficiently that the selected materials may overlap with a 266nm wavelength. Therefore we added to our test the target composition (Al, Cu, C) as a variable to see if a better suited material can be identified.
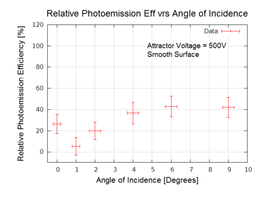
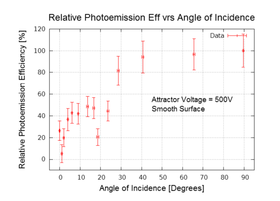
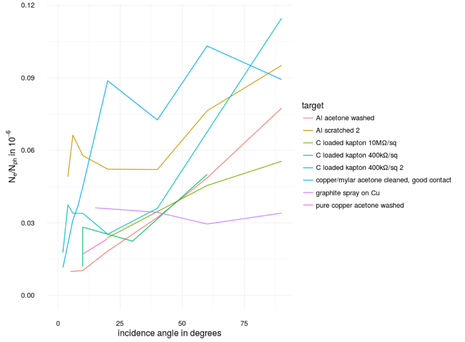
In the Alpha-g case, the laser incident angle is grazing the cathode surface. Hence we included in the incident angle of the laser beam on target as a variable as well (see. Figure 4). Our tests did not reproduce the T2K results. That ratio of collected electron to the estimated number of photons on target versus the photon (laser beam) incident angle is not as large as seen in T2K at normal incidence. But we did expect to see a large variation of electron emission as we move away of a normal incidence. A proposed method to recover those “missing” electron due to the grazing incident angle, was to “scratch” the surface of the target (aluminum) to have some normal area to the incident laser light (note that 90deg incident angle is normal to the surface). This is visible with the “Al scratched 2” plot (the Alpha-g incident angle range is between 0.5 and 45deg). The effect of the scratching does increase the emission at grazing angle quite substantially, which is what we were looking for.
Unfortunately it was not possible to get reasonable values comparing different target materials. It remains unclear why this is the case.
The material options for strip/cathode combinations were aluminum on copper or aluminum on carbon loaded Kapton. Both cathode materials are suitable for the rTPC. In light of the prototype results shown above it was decided to stick with the copper cathode and scratched aluminum strips.
Wavelength 266nm, Photon energy: 4.66 eV
| Material | Work function (eV) |
|---|---|
| Cu | 4.53 – 5.10 |
| Al | 4.06 – 4.26 |
| C | ~5 |
Figure 12 - Photoemission versus incident angle for Aluminum
Figure 13 - Ratio of electron per photon versus incident angle for different base material

