Status Page
Links
Purpose
The purpose of the mhttpd status page is to allow the user to control and monitor the experiment.
Access the status page
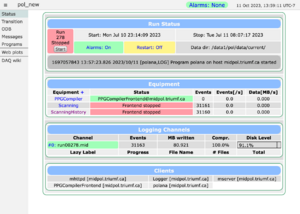
If the MIDAS web server mhttpd is running, the experiment can be accessed from the web (see usage. An example of the status page is shown in Figure 1. By default, anyone can access the experiment via the web. Web access restrictions to the experiment can be set by the user (see Security).
Page Refresh
It is important to note that the refresh of the Status Page is not "event driven" but is controlled by a timer whose rate is adjustable through the Config button. This means the information at any given time may reflect the experiment state of up to n seconds in the past, where n is the timer setting of the refresh parameter.
Features of the status page
| Click image to enlarge |
The status page is divided into several parts
|
Menu Buttons
The top row of Menu buttons on the main status page Figure 1 include the run control buttons (Start/Stop/Pause/Resume depending on the run state) and the page switch buttons (e.g. ODB, Messages, Elog, Alarms, Programs, History, Sequencer, MSCB, Help). Clicking on a page switch button will replace the Status page with the requested page. Many of the pages contain a Status button to return to the Status page, or the browser "Back" button can be used.
For the Config button see page refresh.
Not all the available buttons may be visible on the main status page. Keys in the /Experiment ODB tree control which menu buttons are visible on the status page. The user may change these as required. The Menu Buttons key lists the buttons to appear on the page. The Start/Stop buttons and Pause/Resume buttons may be suppressed using the Start-Stop Buttons and Pause-Resume Buttons keys respectively. The MSCB button will only be visible if MSCB support has been built into Midas.
Optional Buttons
On the Status page (Figure 1), below the Menu Buttons, there may be up to three rows of optional user-added buttons. These may include
In Figure 1, test is a script-button, ppg-cycle is a custom-button, the other buttons on the line are all alias-buttons.
Alarm Banner
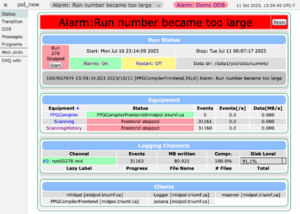
The alarms (see Alarm System) are configured using the Alarms Page. If an alarm is triggered, a banner appears on the status page as shown in Figure 2.
The alarm may be reset with the Reset button on the banner (or on the Alarms Page). However, unless the alarm condition is resolved, the alarm will be triggered again at an interval given by Check interval, causing the alarm banner to reappear. To see which alarm(s) have triggered, check the Alarms Page.
The alarm message and colour of the banner are configured in the ODB /Alarms/<alarm-name> and /Alarms/<class-name> subtrees respectively.
Run Status Information
The run status information on the status page (Figure 1) displays important information, such as the run status, alarm system status and data directory. The run may also be started/stopped using the button provided. The colour or information changes depending whether the run is active or not (e.g. run elapsed time or run stop time). By default, the experiment name is also shown here. The user may choose to display other useful information in this area (see Status items.
The last item in this area is a one-line display of the last Midas message. More messages can be viewed on the Message page by clicking Message.
Equipment Information
On the status page (Figure 1), the Equipment Information area shows the status (by colour) of any defined Equipments (unless hidden). If Hidden equipments are present, they may also be displayed by clicking on the "+" link above the equipment names. This area also displays the number of events sent, the event rate and the data rate. These values are found in the Statistics subtree for each Equipment.
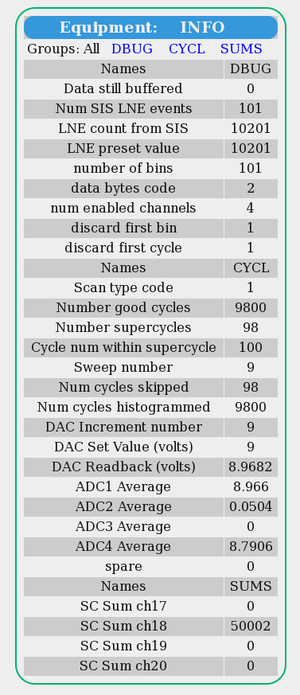
The names of the equipments are links to the /Equipment/<equipment-name>/Variables subtree. If the Equipment sends data to the ODB (see Log History and RO_ODB flag), clicking on this link will display the contents of the /Equipment/<equipment-name>/Variables subtree with the name of each variable if the <Names> subtree has been set up (Figure 2).
Logging Channels
This section on the status page (Figure 1) contains a display of the status of open logging channels, number of events logged, disk usage etc.
Clients
The Clients area on the status page (Figure 1) displays the names of the clients that are currently running.


