|
|
|
Back
Midas
Rome
Roody
Rootana
|
| Midas DAQ System |
Not logged in |
 |
|
|
 14 Aug 2019, Stefan Ritt, Info, New history plot facility 14 Aug 2019, Stefan Ritt, Info, New history plot facility 
|
 06 Sep 2019, Andreas Suter, Info, New history plot facility 06 Sep 2019, Andreas Suter, Info, New history plot facility  
|
 06 Sep 2019, Stefan Ritt, Info, New history plot facility 06 Sep 2019, Stefan Ritt, Info, New history plot facility
|
 06 Sep 2019, Andreas Suter, Info, New history plot facility 06 Sep 2019, Andreas Suter, Info, New history plot facility 
|
 07 Sep 2019, Stefan Ritt, Info, New history plot facility 07 Sep 2019, Stefan Ritt, Info, New history plot facility  
|
 08 Sep 2019, Stefan Ritt, Info, New history plot facility 08 Sep 2019, Stefan Ritt, Info, New history plot facility 
|
 10 Sep 2019, Andreas Suter, Info, New history plot facility 10 Sep 2019, Andreas Suter, Info, New history plot facility 
|
 16 Sep 2019, Konstantin Olchanski, Info, New history plot facility 16 Sep 2019, Konstantin Olchanski, Info, New history plot facility
|
 17 Sep 2019, Andreas Suter, Info, New history plot facility 17 Sep 2019, Andreas Suter, Info, New history plot facility
|
 17 Sep 2019, Konstantin Olchanski, Info, New history plot facility 17 Sep 2019, Konstantin Olchanski, Info, New history plot facility
|
 16 Sep 2019, Konstantin Olchanski, Info, New history plot facility 16 Sep 2019, Konstantin Olchanski, Info, New history plot facility
|
 16 Sep 2019, Stefan Ritt, Info, New history plot facility 16 Sep 2019, Stefan Ritt, Info, New history plot facility
|
|
|
Message ID: 1678
Entry time: 07 Sep 2019
In reply to: 1675
|
| Author: |
Stefan Ritt |
| Topic: |
Info |
| Subject: |
New history plot facility |
|
|
> This I found out, yet the attachment here shows another case where it would be useful to be
> able to disable the background, namely if you have positive and negative measures in one
> plot. Somehow it suggests that CH1 and CH2 show very different values, whereas it is only a
> difference in the sign of this variables.

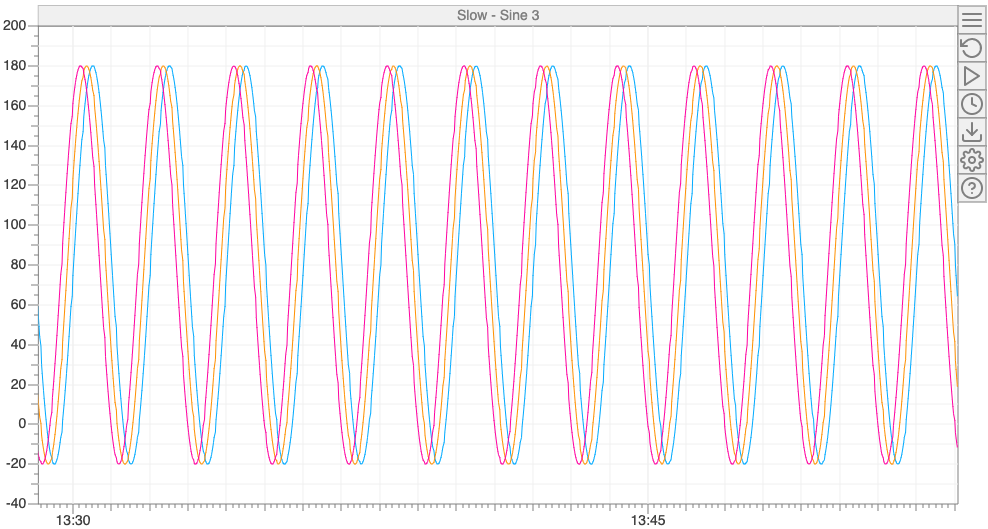
Ok, I added an option which lets you switch off the background.

I also changed the background drawing such that it only goes to the y=0 axis, not the bottom of the screen.
That should help displaying negative values.

Stefan |
|
|

|