Rootana Analyzer Framework
Introduction
The ROOTANA analyzer framework is set of classes that provides the following functionality
- A class TRootanaEventLoop that handles most of the functionality associated with an event loop. The user creates a derived class that inherits from TRootanaEventLoop.
- A set of bank decoder classes.
- These classes depend on the Midas interface classes (TMidasFile, TMidasEvent, TMidasOnline).
Related to this framework is rootana Display Framework and rootana javascript displays.
Event Loop Class
The TRootanaEventLoop provides the functionality to handle many of the features for a standard event loop including
- looping over events in a midas file or
- getting online events by connecting to midas server
The idea is that the user provides a class that derives from TRootanaEventLoop. This derived class would provides begin-of-run actions, end-of-run actions and midas event actions.
The following simple example shows a full program that simply prints out the event number for each event:
#include <stdio.h>
#include "TRootanaEventLoop.hxx"
class Analyzer: public TRootanaEventLoop {
public:
  Analyzer() {};
  virtual ~Analyzer() {};
  void BeginRun(int transition,int run,int time){}

  // Get the midas event and print event number
  bool ProcessMidasEvent(TDataContainer& dataContainer){
    std::cout << "Event Number " << dataContainer.GetMidasEvent().GetSerialNumber() << std::endl;
    return true;
  }
};

int main(int argc, char *argv[])
{
  Analyzer::CreateSingleton<Analyzer>();
  return Analyzer::Get().ExecuteLoop(argc, argv);
}
Software note: the use of singleton for the event loop is an awkward way of making the event loop class member functions compatible with the regular functions that MIDAS expects.
Histogram Creation, Begin-Of-Run/End-Of-Run
Users will naturally want to create and fill ROOT histograms. This needs to be done with some care because of:
- interaction with the output ROOT file: by default, for each run, the analyzer opens a new ROOT file (outputNNNNN.root) and make it the current directory (gOutputFile) for newly created ROOT objects, i.e. those created by "new TH1(...)". At the end of a run, all these objects are saved into the file, the file is closed and all these objects disappear from memory. To create ROOT objects that persist across runs, use some other ROOT directory (i.e. gOnlineHistDir->cd()).
- when using the netDirectoryServer (HAVE_LIBNETDIRECTORY), the contents of gOnlineHistDir and gOutputFile are exported to outside applications. Other programs, i.e. ROODY, can use TNetDirectory to "see" the histograms (and other objects) as they are filled. (Note: this does not work for most TTree objects because they cannot be easily "exported").
The general rule is therefore that you should create histograms in your event loop BeginRun() function, rather than in the constructor or the Initialize() method. That is the only way to ensure that the histograms are created after the output ROOT file is created. Also, you should ensure that you delete the old histograms before producing new ones. The following example shows how this would look:
#include <stdio.h>
#include "TRootanaEventLoop.hxx"
#include <TH1F.h>

class Analyzer: public TRootanaEventLoop {
private:

  TH1F* evtno_histo; // histogram the event numbers.

public:

  Analyzer() {
    evtno_histo = 0; // initialize pointer to null.
  };

  virtual ~Analyzer() {};

  void BeginRun(int transition,int run,int time){
    // delete old histogram, if it exists.
    TH1F *old = (TH1F*)gDirectory->Get("evtno_histo");
    if (old) delete old;

    // create new histogram
    evtno_histo = new TH1F("evtno_histo","Event Number Histogram",1000,0,10000);
  }

  bool ProcessMidasEvent(TDataContainer& dataContainer){
    evtno_histo->Fill(dataContainer.GetMidasEvent().GetSerialNumber());
    return true;
  }
};

int main(int argc, char *argv[])
{
  Analyzer::CreateSingleton<Analyzer>();
  return Analyzer::Get().ExecuteLoop(argc, argv);
}
You also have disable the automatic creation of ROOT files for each run by using the function TRootanaEventLoop::DisableRootOutput(true) and then create histograms where ever you want in your program.
Program Flow Control
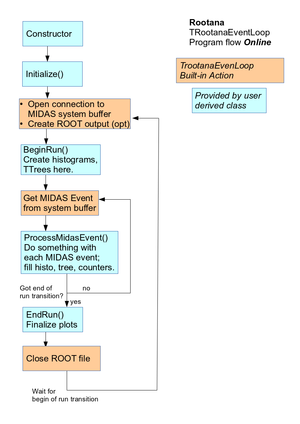
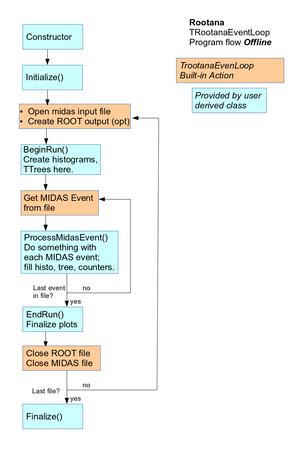
The following images try to describe the program flow graphically (left side is online mode = reading from MIDAS SYSTEM buffer, right side is offline mode = reading from file).
The diagrams specify which elements of the program are provided by the framework and which need to be added by the user.
There are a number of additional options provided by the TRootanaEventLoop, which are not shown in that figure. These include
- Redefining TRootanaEventLoop:PreFilter(TDataContainer& dataContainer) allows the user to specify which event should be processed; for instance, perhaps only some types of triggers are worth plotting.
- Similarly, user can call ProcessThisEventID(int eventID) to specify that only certain MIDAS event IDs should be processed; this method can be called repeatedly to add many event IDs.
Details on the methods can be seen in the TRootanaEventLoop header file.
Bank Decoder
Naturally we want to do more than just checking the event numbers; we need to process the data in the data banks. The rootana analyzer classes facilitate this by providing decoding classes for a number of standard MIDAS banks.
Since the data being stored in each bank is different, the format of the decoder classes will also be quite different. You should see the individual decoders to see how the data is organized; for now we currently have the following decoders (mostly for CAEN modules): TV792Data, TV1190Data, TDT5724, TV1720, TV1730, TMesytecData.
The following example shows how to acces information for a particular V792 bank called 'ADC0' and histogram the results:
#include <stdio.h>
#include "TRootanaEventLoop.hxx"
#include <TH1F.h>
#include <TV792Data.hxx>

class Analyzer: public TRootanaEventLoop {
private:

  TH1F* adc; // ADC spectrum for all V792 channels in bank.

public:

  Analyzer() {
    adc = 0; // initialize pointer to null.
  };

  virtual ~Analyzer() {};

  void BeginRun(int transition,int run,int time){
    // delete old histogram, if it exists.
    TH1F *old = (TH1F*)gDirectory->Get("adc");
    if (old) delete old;

    // create new histogram
    adc = new TH1F("adc","V792 ADC Spectrum",4200,0,4200);
  }

  bool ProcessMidasEvent(TDataContainer& dataContainer){

    // Get pointer to the V792 decoded data; need to provide the
    // bank name.
    TV792Data *data = dataContainer.GetEventData<TV792Data>("ADC0");
    if(data){
      // Loop over all measurement for all channels
      std::vector<VADCMeasurement> measurements = data->GetMeasurements();
      for(unsigned int i = 0; i < measurements.size(); i++){ // loop over measurements
        adc->Fill(measurements[i].GetMeasurement());
      }
    }

    return true;
  }
};

int main(int argc, char *argv[])
{
  Analyzer::CreateSingleton<Analyzer>();
  return Analyzer::Get().ExecuteLoop(argc, argv);
}
You can also get access to the raw information in the MIDAS banks, if you haven't yet written a decoder for a particular bank type. You do this by doing accessing a bank using the TGenericData class.
Histogram Classes
We also provide an abstract base class for sets of histograms: THistogramArrayBase. The derived histogram-set class would specify how to create and fill an interesting set of histograms. The goal is that these generic histogram-sets would make it easy to provide generic analyzer displays.
Midas2Root
The rootana/examples has a program midas2root that shows an example of how you would write a program that converted the data in a MIDAS file to a TTree in a ROOT file. The user would need to decide themselves how they would store the data in a TTree.
Quick Start
The rootana/examples directory contains analysis code appropriate for processing 'standard' TRIUMF MIDAS data taken with CAEN V792, V1190, CAMAC TL2249 and Agilent data.
To use the example code in this directory, we recommend the following steps
1) Install rootana in usual place and make
cd $HOME/packages
git clone https://bitbucket.org/tmidas/rootana
cd rootana
make
2) Set environment variable ROOTANASYS to rootana location (usually $HOME/packages/rootana)
3) Copy this directory (rootana/examples) to somewhere to play with code and build
mkdir ~/analyzer/.
cp ~/packages/rootana/examples/* ~/analyzer/.
cd ~/analyzer
make
4) You will have now build a default analyzer display (anaDisplay.exe) and batch-mode analyzer (ana.exe) that you can use to display CAEN V792 and V1190 data.
You can then modify the files to create new plots.
The files anaDisplay.cxx and ana.cxx contain precompiler flags to quickly enable and disable certain combination of hardware. For instance, the default configuration
#define USE_V792
#define USE_V1190
//#define USE_L2249
//#define USE_AGILENT
will create histograms of V792 and V1190 data. By changing the commented out precompiler flags you can modify the expected hardware.

