Custom Page
Links
Purpose
A user-created mhttpd Custom Web Page accessible from the Status Page allows the user additional flexibility. For example, a custom page may present the essential parameters of the controlled experiment in a more compact way. A custom page may even replace the default Status Page.
Introduction
Custom web pages provide the user with a means of creating secondary user-created web page(s) activated within the standard MIDAS web interface. These custom pages usually display ODB parameters or data to the user. They can contain specific links to the ODB so the user may also input information relevant to the experiment. Users create Custom Pages when the standard pages do not meet their requirements completely.
We note that MIDAS has provided a number of different ways of providing custom pages over the years. A new scheme of custom pages making use of modern HTML5 techniques has been introduced in 2017. This page will mostly only be providing documentation for the new scheme of custom pages.
Examples of Custom Pages
Click on the thumbnails to enlarge.
| Example 1
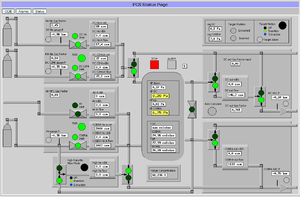
This page (Figure 1) from the MEG experiment at PSI shows a complex gas system. This shows the use of "fills" and "labels". Open valves are represented as green circles, closed valves as red circles. If, for example, an open valve is clicked, the valve closes, and the circle turns red (provided the user successfully supplied the correct password). | |
| Example 2
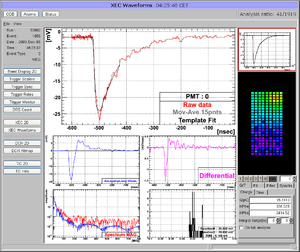
Many MIDAS experiments work with ROOT based analyzers today. One problem is that the graphical output of the root analyzer can only be seen through the X server and not through the web. At the MEG experiment, this problem was solved in an elegant way: The ROOT analyzer runs in the background, using a "virtual" X server called Xvfb. It plots its output (several panels) normally using this X server, then saves this panels every ten seconds into GIF files. These GIF files are then served through mhttpd using a custom page. The output is shown in Figure 2. The buttons on the left sides are actually HTML buttons on that custom page overlaid to the GIF image, which in this case shows one of the 800 PMT channels digitized at 1.6 GSPS. With these buttons one can cycle through the different GIF images, which then automatically update ever ten seconds. Of course it is not possible to feed interaction back to the analyzer (i.e. the waveform cannot be fitted interactively) but for monitoring an experiment in production mode this tool is extremely helpful, since it is seamlessly integrated into mhttpd. All the magic is done with JavaScript, and the buttons are overlaid on the graphics using CSS with absolute positioning. The analysis ratio on the top right is also done with JavaScript accessing the required information from the ODB. For details using Xvfb server, please contact Ryu Sawada <sawada@icepp.s.u-tokyo.ac.jp>. | |
| Example 3
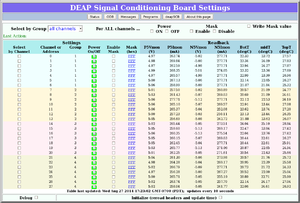
This custom page from the Deap Experiment (Figure 3) allows the users to easily set individual channels, or a group of channels, or all channels of the SCB modules to a particular value. |
Access a Custom Page from the Regular MIDAS pages
Access to a Custom Page is set up through the /Custom ODB tree (see custom-link). This associates a custom page file on the disk with a menu item on the left navigation bar. Clicking on the resulting link will display that custom page.
Often a custom page requires resources such as *.css (stylesheets) or *.js (javascript) files. It is convenient to store all such files with the custom page file (*.html) in a particular directory, e.g. /home/expt/online/custom. By creating an ODB key /Custom/Path, all the custom page files and resources can be served easily from this directory. See Custom Page Features#Resource files for more information.
If the key /Custom/myPage& (see Note) is created, e.g.
odbedit> ls /Custom
   Path                              /home/expt/online/custom
   myPage&                           mypage.html
the custom link on the left navigation bar will be myPage and the URL for the resulting custom page will be of the form http://myhost.mydomain:myport/cmd=?Custom&page=myPage (see also mhttpd#usage).
Clicking on myPage will display the custom page in the same window.
- Note
- Without the "&" symbol in the key name, the page would appear in a new window. See Key names for more information.
How to write a custom page
A custom page is usually written in a combination of HTML and Javascript. It can contain any of the features described below. A Javascript MjsonRPC Library has been written to provide access to the ODB and other functions.
In what follows, we describe a scheme for writing custom pages with the set of modb* javascript functions. The advantages of using these modb* javascript functions are
- modb* functions hide details about the underlying MjsonRPC calls, which should allow a user to write pretty and sophisticated custom pages quickly and cleanly.
- modb* functions ensure that all the periodic updates of the ODB value (and other MIDAS information) are done in a single MjsonRPC batch call, which should ensure optimal page loading speed.
- modb* functions encapsulate the underlying communication. Should the communication change in the future, the custom pages do not have to be changed.
It is also possible for users to write their custom pages using only the underlying MjsonRPC library calls, but they then need to ensure on their own that the page loading remains efficient. In particular, if you combine the standard MIDAS navigation bars (described in next section) with your own periodic MjsonRPC calls then you will probably need at least two separate periodic RPC calls to populate the custom page (instead of one call). It will also require more coding to implement the custom page with only MjsonRPC calls.
If you want to have your custom page use the same header and navigation bars as the standard MIDAS pages, you need to use the following syntax
<!DOCTYPE html>
<html lang="en">
<head>
   <meta charset="UTF-8">
   <link rel="stylesheet" href="midas.css">
   <script src="controls.js"></script>
   <script src="midas.js"></script>
   <script src="mhttpd.js"></script>
   <title>myPage</title>
</head>

<body class="mcss" onload="mhttpd_init('myPage');">

<!-- header and side navigation will be filled in mhttpd_start -->
<div id="mheader"></div>
<div id="msidenav"></div>

<div id="mmain">
 ADD YOUR HTML/JS  CODE here...
</div>
The call mhttpd_init('myPage') is executed when the page is loaded, and myPage is the name of the page shown on the left menu bar. This corresponds to an ODB entry /Custom/myPage.
This pattern will allow you to use the standard MIDAS navigation whether you are using the modb* functions or the underlying javascript libraries.
modb* Javascript scheme
The general scheme of the custom page scheme is to write <div class="modb..."></div> or <span class="modb..."></span> tags with special names, most of them starting with "modb..." ("MIDAS-ODB"). Use a <div> tag if you want the element to appear in a separate line, and use the <span> tag if you want to display the element in-line. The following description uses only <div> tags, but all of them can be changed to <span>. All HTML tags with "modb..." names are scanned by the mhttp_init('name') function upon page load, and their inner contents is replaced by the requested ODB value or some graphics. The contents is then updated regularly. Updates are once per second by default. This can be changed by passing a second argument to mhttpd_init('name', interval) where "interval" is in milliseconds.
modbset(path, value)
To set values in the ODB, the midas JavaScript function mjsonrpc_db_paste() is usually called. This function is implemented as a JavaScript promise, which lets you chain several request in order to change values inside the ODB in a certain order. If that functionality is not required, the simplified modbset() function can be called, which also implements standard error handling. Two versions of this function exist, one which accepts a single ODB path and a single value, and one which accepts an array of ODB paths and values:
modbset("odb path", value)
modbset(["odb path1", "odb path2", ...], [value1, value2, ...])
These functions are typically used by custom JavaScript code, like when some value in an experiment exceeds some limit and some action has to be taken like to close a valve. If the call fails (like if mhttpd is dead), a window with an error description is shown.
modb
This special HTML div tag (abbreviation stands for Midas ODB) <div class="modb" data-odb-path="/Some/Path" onchange="func()"> can be used to call a user-defined function func() if a value in the ODB changes. This function must be defined inline or in a separate <script>...</script> section, and can execute any operation, such as opening a dialog box, hiding/unhiding parts of the custom page, or changing colors and styles of page elements.
The current value of the ODB entry is available inside the "onchange" function as this.value. Following tag will call a function which logs the current run number in the JavaScript console window:
<div class="modb" data-odb-path="/Runinfo/Run number" onchange="func(this.value)">
<script>function func(value) {
console.log(value);
}</script>
If the ODB path does not point to an individual value but to a subdirectory, the whole subdirectory is mapped to this.value as a JavaSctipt object such as
<div class="modb" data-odb-path="/Runinfo" onchange="func(this.value)">
<script>function func(value) {
console.log(value["run number"]);
}</script>
Note that ODB entries are mapped to JavaScript objects without change. So if an ODB entry name contains a blank, it must be accessed via the JS square bracket value["run number"] as shown in the above example. Otherwise, the entry can be accessed via the dot notation, such as value.state for /Runinfo/State for example.
modbvalue
This special HTML div tag (abbreviation stands for "Midas ODB VALUE")
<div class="modbvalue" data-odb-path="/Some/Path">
is now automatically replaced by the value in the ODB found at the given path and updated regularly as described above Following options are valid for this tag:
| Option | Example | Meaning |
|---|---|---|
| data-name | class="modbvalue" | Tells the framework to replace this tag with an ODB value |
| data-odb-path | data-odb-path = "/Runinfo/Run number" | Path to the value in the ODB |
| data-odb-editable | data-odb-editable="1" | If set, the value is not only shown, but is also clickable for in-line editing. Hitting return send the new value to the ODB. |
| data-format | data-format="f3" | Specify format of data shown. See Table 2 below for options. |
Table 2 below lists the format specifiers supported with a modbvalue tag data-format="...":
| Option | Example | Meaning |
|---|---|---|
| d | 1234 | Shows a number in decimal encoding |
| x | 0x4D2 | Shows a number in hexadecimal encoding |
| b | 10011010010b | Shows a number in binary encoding. Options d, x, b can be combined, like data-format="dxb"
|
| f<x> | 1.234 | Shows a floating point number with <x> digits after the decimal. A value of f0 shows only the integer part. |
| p<x> | 1.23 | Shows a floating point number with <x> significant digits of precision, independent of the decimal. For example a value of p2 can render a number to 12000 or to 0.00012 |
modbbutton
This tag generates a push-button which can set a certain ODB entry to a specific value. To set the "Run number" to 100, one can use the following tag:
<button class="modbbutton" class="mbutton" data-odb-path="/Runinfo/Run number" data-odb-value="100">[Button Text]</button>
modbcheckbox
This tag generates a check box which can set a certain ODB entry to true or false. To set the "Write data" flag for the logger true or false, one can use the following tag:
<input type="checkbox" class="modbcheckbox" data-odb-path="/Logger/Write data" />
If the ODB value changed by this control is of type integer, its value will be set to 1 or 0.
modbhbar
The following tag:
<div class="modbhbar" style="width: 500px; height: 18px;" data-odb-path="/Runinfo/Run number" data-max-value="10" data-color="lightgreen" ></div>
shows a horizontal bar with a total length of 500px. Depending on the ODB value
Run number. If
Run number is 10, then the bar is filled all the way to the right, if
Run number is 5, the bar is only filled halfway. Following options are possible:
| Setting | Meaning | Required |
|---|---|---|
| style="width: 500px" | Total width of the horizontal bar | Yes |
| style="height: 18px" | Height of the horizontal bar | Yes |
| style="color: red" | Color of horizontal bar | Transparent if not present |
| style="background-color: red" | Background color of horizontal bar | Transparent if not present |
| data-odb-path | ODB path of value being displayed | Yes |
| data-min-value | Left limit of bar range | 0 if not present |
| data-max-value | Right limit of bar range | 1 if not present |
| data-log | Logarithmic display | No |
| data-print-value | If "1", data value is shown as text overlay | No |
mhaxis
A horizontal bar can be combined with an axis with tick marks and labels. The axis can be above or below the bar.
The following tag:
<div class="mhaxis" style="width: 500px; height: 22px;" data-min-value="0" data-max-value="10" ></div>
shows a horizontal axis next to the bar. Following options are possible:
| Setting | Meaning | Required |
|---|---|---|
| style="width: 500px" | Total width of the axis, must match the width of the horizontal bar | Yes |
| style="height: 18px" | Height of the axis, must be enough to display labels | Yes |
| style="vertical-align: top" | Must be "top" if the axis is below the bar | "bottom" if not given |
| data-min-value | Left limit of axis range | Yes |
| data-max-value | Right limit of axis range | Yes |
| data-log | Logarithmic display | No |
modbvbar
Same as modbhbar, except the bar grows vertically instead of horizontally.
mvaxis
Same as mhaxis, except the axis is shown vertically instead of horizontally.
modbthermo
The following tag:
<div class="modbthermo" style="width: 30px; height: 100px;" data-odb-path="/Runinfo/Run number" data-min-value="-10" data-max-value="30" data-color="blue" data-print-value="1" ></div>
shows a vertical thermometer ranging from -10 to 30. Depending on the ODB value
Run number. The run number was chosen instead of a real temperature since this ODB variable exists in all midas installations by default, so it's good for testing. Following options are possible:
| Setting | Meaning | Required |
|---|---|---|
| style="width: 30px" | Width of the thermometer | Yes |
| style="height: 100px" | Total height of the thermometer | Yes |
| data-odb-path | ODB path of value being displayed | Yes |
| data-max-value | Upper range | Yes |
| data-min-value | Lower range | 0 if not present |
| data-color | Color of thermometer | Black if not present |
| data-background-color | Color of thermometer background | Transparent if not present |
| data-print-value | If "1", data value is shown below the thermometer | No |
| data-format | Specifies format of temperature shown below gauge. See Table 2 for options. | No |
modbgauge
The following tag:
<div class="modbgauge" style="width: 100px; height: 50px;" data-odb-path="/Runinfo/Run number" data-min-value="0" data-max-value="10" data-color="darkgreen"></div>
shows a circular gauge ranging from 0 to 10. Depending on the ODB value "Run number". Following options are possible:
| Setting | Meaning | Required |
|---|---|---|
| style="width: 100px" | Width of the gauge | Yes |
| style="height: 50px" | Total height of the gauge | Yes |
| data-odb-path | ODB path of value being displayed | Yes |
| data-max-value | Upper range | Yes |
| data-min-value | Lower range | 0 if not present |
| data-color | Color of gauge | Black if not present |
| data-background-color | Color of gauge background | Transparent if not present |
| data-print-value | If "1", data value is shown below the gauge | No |
| data-format | Specifies format of temperature shown below gauge. See Table 2 for options. | No |
| data-scale | If "1", the min and max values of the range are shown below the gauge | No |
If the gauge scale is not shown, the gauge height should be half the gauge width. If the scale is shown, 15px must be added to the height.
mhistory
Custom pages can contain one or more specific history panels usually shown on the "History" page. This makes it easy to combine current readings of values together with the history of these values.
The following tag:
<div class="mhistory" data-group="<group>" data-panel="<panel>" style="width: 320px; height: 200px;" ></div>
shows a history panel defined in the ODB under /History/Display/<group>/<panel> (replace <group>/<panel> with groups and panels from your experiment).
Following options are possible:
| data-group | ODB group of history. Has to match a group under /History/Display | Yes |
| data-panel | ODB panel name of history. Has to match a panel name under /History/Display/<group>/ | Yes |
| data-scale | Time scale of history plot. Use 10m for 10 minutes and 5h for 5 hours. If not specified, the value from the ODB under /History/Display/<group>/<panel>/Timescale is used. | No |
| style="width: 320px" | Width of the history panel | No |
| style="height: 200px" | Height of the history panel | No |
| style="border: 1px solid black" | Border around the history panel | No |
If width and height are omitted, the default values of 320px and 200px are used. History panels are automatically updated every 30 seconds.
NOTE: It is planned to change the static history panels to dynamic ones using JavaScript. This will allow users to interactively zoom and scroll through the history with the mouse. The syntax of the "mhistory" tag will however stay the same so it is safe to use this tag now without having to change it after dynamic panels are implemented.
Changing properties of controls dynamically
All custom controls can be changed dynamically (meaning depending on their value) by implementing a onchange function. This function has access to the current value and can change any of the parameters of the control. Following callback for example changes the color of a thermometer to red if the value is above 30 and to blue if it is below:
onchange="this.dataset.color=this.value > 30?'red':'blue';"
Complete Example
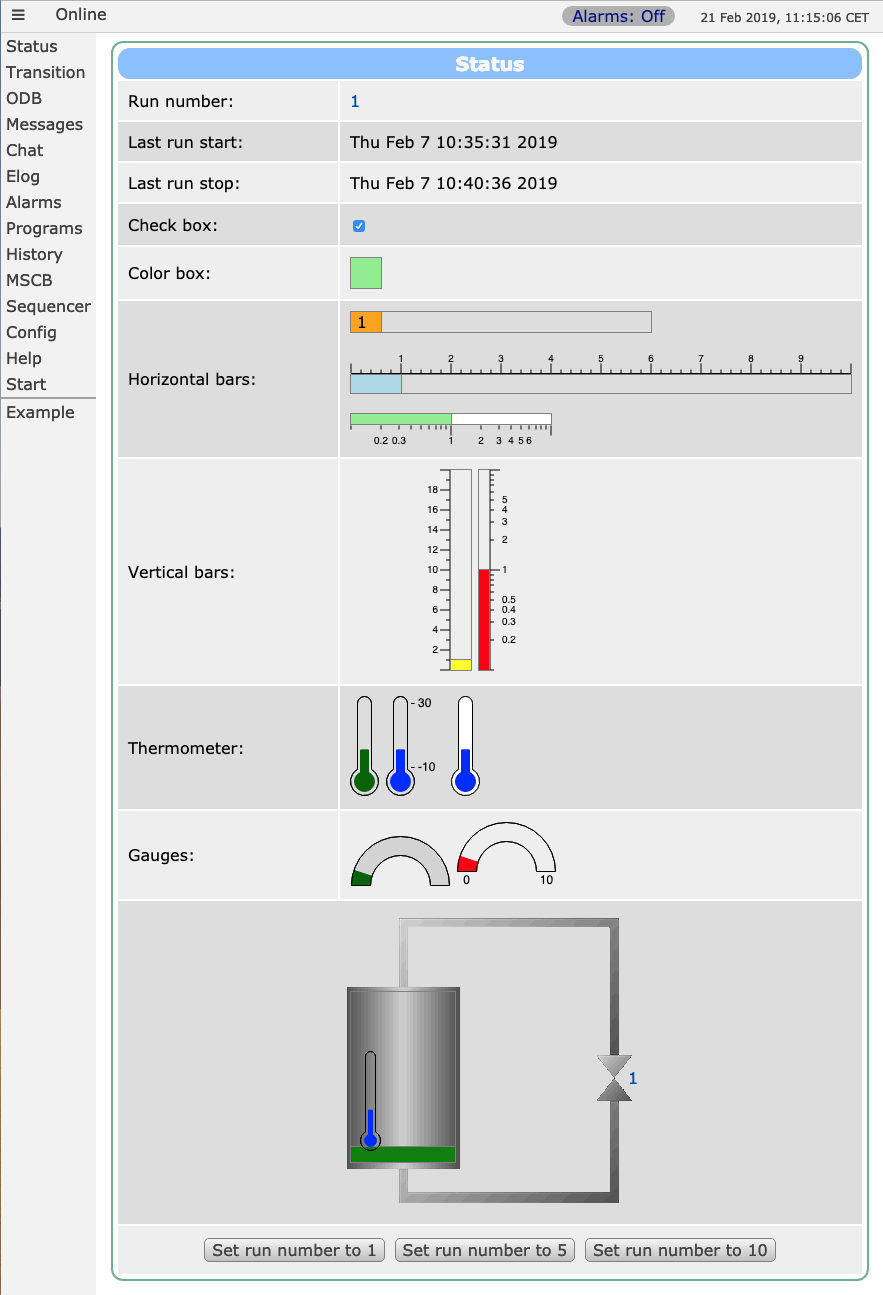
The following code shows an example page (contained in resources/a_example.html in the MIDAS distribution) of a custom page implementing most of the new features. You activate this page by putting in the ODB:
/Custom
  Path     /midas/resources
  Test     a_example.html
Code
The file a_example.html contains the following code:
<!DOCTYPE html>
<html class="mcss">
<head>
   <meta charset="UTF-8">
   <link rel="stylesheet" href="midas.css">
   <script src="controls.js"></script>
   <script src="midas.js"></script>
   <script src="mhttpd.js"></script>
   <title>Example</title>

   <style>
      .mtable td { padding: 10px; }
   </style>
</head>

<body class="mcss" onload="mhttpd_init('Example');">

<!-- header and side navigation will be filled in mhttpd_init -->
<div id="mheader"></div>
<div id="msidenav"></div>

<div id="mmain">
   <table class="mtable">
      <tr>
         <th colspan="2" class="mtableheader">Status</th>
      </tr>
      <tr>
         <td style="width: 200px;">
            Run number:
         </td>
         <td>
            <div name="modbvalue" data-odb-path="/Runinfo/Run number" data-odb-editable="1"></div>
         </td>
      </tr>
      <tr>
         <td>
            Last run start:
         </td>
         <td>
            <div name="modbvalue" data-odb-path="/Runinfo/Start time"></div>
         </td>
      </tr>
      <tr>
         <td>
            Last run stop:
         </td>
         <td>
            <div name="modbvalue" data-odb-path="/Runinfo/Stop time"></div>
         </td>
      </tr>
      <tr>
         <td>
            Check box:
         </td>
         <td>
            <!-- checkbox changes /Logger/Write data, fire dialog box on change (even if changed by odbedit) -->
            <input type="checkbox" name="modbcheckbox" data-odb-path="/Logger/Write data"></input>

            <div name="modb" data-odb-path="/Logger/Write data" onchange="dlgAlert('Flag has changed');"></div>
         </td>
      </tr>
      <tr>
         <td>
            Color box:
         </td>
         <td>
            <!-- box changes color according to /Logger/Write data -->
            <div name="modbbox" style="width: 30px; height: 30px;" data-odb-path="/Logger/Write data"
                 data-color="lightgreen" data-background-color="red"></div>
         </td>
      </tr>
      <tr>
         <td>
            Horizontal bars:
         </td>
         <td>
            <div name="modbhbar" style="width:300px;height:20px;color:orange;" data-odb-path="/Runinfo/Run number"
                 data-max-value="10" data-print-value="1"></div><br />

            <div name="mhaxis" style="width:500px;height:22px;" data-min-value="0" data-max-value="10"></div>
            <div name="modbhbar" style="width: 500px; height: 18px;color:lightblue" data-odb-path="/Runinfo/Run number"
                 data-max-value="10"></div><br />

            <div name="modbhbar" style="width: 200px; height: 10px;color:lightgreen;background-color:white"
                 data-odb-path="/Runinfo/Run number" data-min-value="0.1" data-max-value="10" data-log="1"></div>
            <div name="mhaxis" style="width:200px;height:22px;vertical-align:top;" data-min-value="0.1"
                 data-max-value="10" data-line="0" data-log="1"></div>
         </td>
      </tr>
      <tr>
         <td>
            Vertical bars:
         </td>
         <td>
            <span name="mvaxis" style="width:100px;height:200px;text-align:right;" data-min-value="0" data-max-value="20"></span><span name="modbvbar"
                  style="width:20px;height:200px;color:yellow;" data-odb-path="/Runinfo/Run number"
                  data-min-value="0" data-max-value="20"></span>
            <span name="modbvbar" style="width:10px;height:200px;vertical-align:top;color:red" data-odb-path="/Runinfo/Run number" data-min-value="0.1"
                  data-max-value="10" data-log="1"></span><span name="mvaxis" style="width:100px;height:200px;text-align:left;" data-min-value="0.1"
                                                                data-max-value="10" data-log="1"></span>
         </td>
      </tr>

      <tr>
         <td>
            Thermometer:
         </td>
         <td>
            <div name="modbthermo" style="width:30px;height:100px;" data-odb-path="/Runinfo/Run number" data-min-value="-10" data-max-value="30"
                 data-color="darkgreen"></div>
            <div name="modbthermo" style="width:60px;height:100px;" data-odb-path="/Runinfo/Run number" data-min-value="-10" data-max-value="30"
                 data-color="blue" data-scale="1"
                 onchange="this.dataset.color=this.value > 9?'red':'blue';"></div>
            <div name="modbthermo" style="width:30px;height:100px;" data-odb-path="/Runinfo/Run number" data-min-value="-10" data-max-value="30"
                 data-color="blue" data-background-color="white" data-value="1"></div>
         </td>
      </tr>

      <tr>
         <td>
            Gauges:
         </td>
         <td>
            <div name="modbgauge" style="width:100px;height:50px;" data-odb-path="/Runinfo/Run number" data-min-value="0" data-max-value="10"
                 data-color="darkgreen" data-background-color="lightgrey" ></div>
            <div name="modbgauge" style="width:100px;height:65px;" data-odb-path="/Runinfo/Run number" data-min-value="0" data-max-value="10"
                 data-color="red" data-value="1" data-scale="1"></div>
         </td>
      </tr>

      <tr>
         <td colspan="2" style="text-align: center;">
            <!-- div around image with "relative" position as anchor for labels and bars -->
            <div style="position:relative;width:300px;margin:auto">

               <img src="tank.gif"> <!-- background image of tank -->

               <!-- label next to valve -->
               <div name="modbvalue" data-odb-path="/Runinfo/Run number" data-odb-editable="1"
                    style="position:absolute;top:157px;left:288px;"></div>

               <!-- vertical bar inside tank, render red if value > 9 -->
               <div name="modbvbar" style="position:absolute;top:80px;left:10px;width:104px;height:170px;"
                    data-odb-path="/Runinfo/Run number" data-max-value="11" data-color="green"
                    onchange="this.firstChild.style.backgroundColor=(this.value > 9)?'red':'green';"></div>

               <!-- thermometer inside tank -->
               <div name="modbthermo" style="position:absolute;top:140px;left:20px;width:20px;height:100px;"
                    data-odb-path="/Runinfo/Run number" data-min-value="-10" data-max-value="30"
                    data-color="blue" data-value="1"></div>

            </div>
         </td>
      </tr>

      <tr>
         <td colspan="2" style="text-align: center;">
            <!-- three buttons to change an ODB entry (run number in this example) -->
            <button name="modbbutton" class="mbutton" data-odb-path="/Runinfo/Run number" data-odb-value="1">Set run
               number to 1
            </button>
            <button name="modbbutton" class="mbutton" data-odb-path="/Runinfo/Run number" data-odb-value="5">Set run
               number to 5
            </button>
            <button name="modbbutton" class="mbutton" data-odb-path="/Runinfo/Run number" data-odb-value="10">Set run
               number to 10
            </button>
         </td>
      </tr>
   </table>
</div>

</body>
</html>
which results in the page shown in Figure 1 below:
Old custom page feature
There are a number of deprecated custom page features, which can be seen here: Old Custom Page Features.


