History Page
Links
Purpose
The purpose of the mhttpd History Web Page to display data from the History System in graphical form, giving the user an easy way of seeing how experimental variables have changed with time.
Access to the History Page
The History Page is displayed by clicking on the History button on the mhttpd Status Page or other mhttpd web page.
- Note
- If "History" button is not present on the Status Page, it may have been suppressed.
Features of the History Page
Click on a thumbnail to enlarge
The History Page takes much of its information from the /History ODB tree.
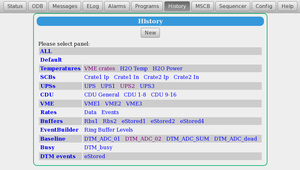
Figure 1 shows the History Page from the Deap experiment. This page shows the panels and sub-panels defined in the /History/Display subtree.
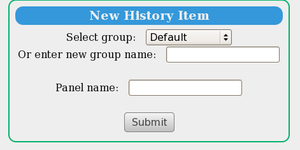
New panels are added by the user with the New button (Figure 3). Up to 10 history channels per page are supported.
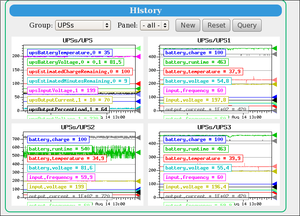
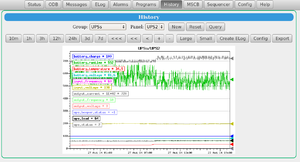
Figure 3 shows the History display for all the panels in the Group UPSs. One of the panels from the group (i.e. UPS2) is shown in Figure 4.
At the top of the History panel display (Figure 4) are drop-down lists of the possible group names and panels defined in the ODB. These are used for navigation among the History plots.
Below, a series of buttons are provided to
- define the time scale of the graph with predefined time window (e.g. 10m last 10 minutes, 1h last hour etc.)
- permit the shifting of the graph in the time direction, i.e. << < < + -
- resize the graphs Large Small
- create an Elog attachment Elog
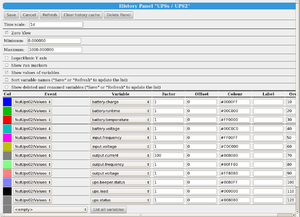
Configuring the panel is done via the Config button, which displays the Configuration page (Figure 5).
The configuration options for a given panel include
- Zooming capability, run markers, logarithmic scale.
- custom time frame graph display
- Data query in time.
- Time scale in date format.
- Sorting variables
- Deleting panel
