| ID |
Date |
Author |
Topic |
Subject |
|
1644
|
06 Aug 2019 |
Stefan Ritt | Info | Precedence of equipment/common structure | After some internal discussion, I decided to undo my previous change again, in order not to break existing habits. Instead, I created a new function
set_odb_equipment_common(equipment, name);
which should be called from frontend_init() which explicitly copies all data from the equipment structure in the front-end into the ODB.
Stefan |
|
1649
|
08 Aug 2019 |
Konstantin Olchanski | Info | c++11 for RHEL/SL/CentOS-6 | The default el6 (RHEL/SL/CentOS-6) compiler is gcc-4.4.7, it does not support c++11, not even a little bit.
Do this to install newer c++ compilers and build MIDAS with c++11:
ssh root@sl6machine
# yum install centos-release-scl-rh
# yum install devtoolset-8
# yum install cmake3
# scl -l
devtoolset-8
...
$ ssh user@sl6machine
$ scl enable devtoolset-8 bash
$ gcc -v
COLLECT_LTO_WRAPPER=/opt/rh/devtoolset-8/root/usr/libexec/gcc/x86_64-redhat-linux/8/lto-wrapper
gcc version 8.3.1 20190311 (Red Hat 8.3.1-3) (GCC)
$ cd git/midas
$ make cclean
$ make cmake3
$ ls -l bin/odbedit
K.O. |
|
1650
|
08 Aug 2019 |
Konstantin Olchanski | Info | MIDAS will use C++11 | After much discussion, and following the MIDAS workshop at TRIUMF, we made the decision to use C++11 in MIDAS.
There are many benefits, and only one drawback - no c++11 compilers in the default OS install on older computers (i.e.
RHEL/SL/CentOS before el7). (the same applies to our use of cmake).
Specifically for el6, the solution is to use c++11 compatible gcc-8 from devtoolset-8, see
https://midas.triumf.ca/elog/Midas/1649
The c++11 features we most welcome - initialization of class members at declaration time (no more forgetting to add initialization to
each and every constructor), c++ threads and mutexes, lambdas and "auto".
K.O. |
|
1656
|
09 Aug 2019 |
Konstantin Olchanski | Info | Precedence of equipment/common structure | > Today I fixed a long-annoying problem. ...
> /Equipment/<name>/Common
> In the past, the ODB setting took precedence over the frontend structure...
> We defined this like 25 years ago and I forgot what the exact reason was.
> It causes however many people (including myself) to fall into this trap: ...
There is good number of confusions regarding entries in /eq/xxx/common:
- for some of them, the frontend code settings take precedence and overwrite settings in odb ("frontend file name")
- for some of them, ODB takes precedence and frontend code values are ignored ("read on" and "period")
- for some of them, changes in ODB take effect immediately (via db_watch) ("period")
- for some of them, frontend restart is required for changes to take effect (output event buffer name "buffer")
- some of them continuously update the odb values ("status", "status color")
I do not think there is a simple way to improve on this.
(One solution would replace the single "common" with several subdirectories, "per function",
one would have items where the code takes precedence, one would have items where odb takes
precedence (in effect, "standard settings"), one will have items that the frontend always updates
and that should not be changes via odb ("frontend name", etc). I am not sure this one solution
is necessarily an "improvement").
Lacking any ideas for improvements, I vote for the status quo. (plus a review of the documentation to ensure we have clearly
written up what each entry in "common" does and whether the user is permitted to edit it in odb).
K.O. |
|
1661
|
13 Aug 2019 |
Stefan Ritt | Info | Precedence of equipment/common structure | > Lacking any ideas for improvements, I vote for the status quo. (plus a review of the documentation to ensure we have clearly
> written up what each entry in "common" does and whether the user is permitted to edit it in odb).
I agree with that.
Stefan |
|
1662
|
14 Aug 2019 |
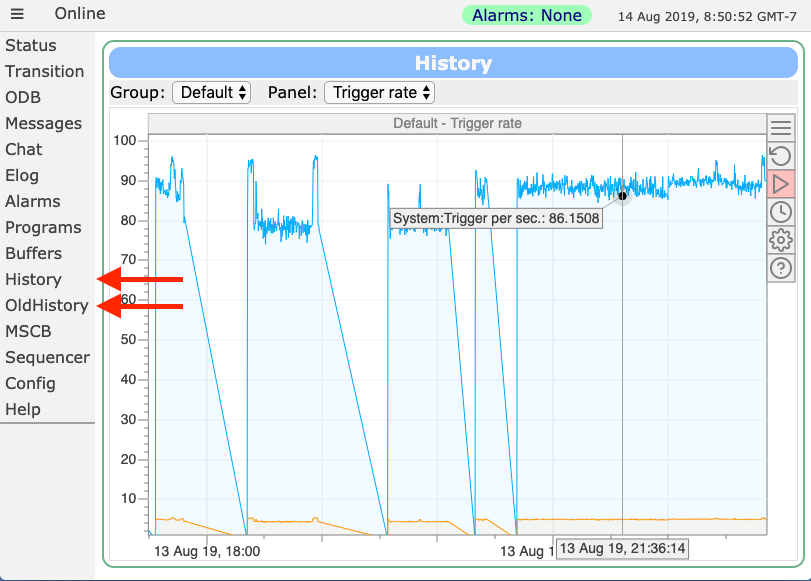
Stefan Ritt | Info | New history plot facility | During my visit at TRIUMF we rewrote the history plotting functionality of midas. Instead of
static GIF images, we have now interactive JavaScript panels where we can scroll, zoom,
inspect values and much more (example is attached). We are now in a state where this is still
work in progress, but already at this stage it might be useful for others to report any
feedback.
Simply upgrade the the newest develop branch of midas, and you will see two menu items
"OldHistory" which is the old system and "History" which is the new system. In the new
system, you can drag with the mouse to scroll, use the mouse wheel to zoom in and out the
time axis, and hover with your mouse over data points to see its value. If you zoom out,
old data is loaded automatically in the background.
Following items are planned, but not yet implemented:
- Printing of run markers as in the old history
- Delete old data in the buffer to limit memory consumption if the browser window is
open for very long (weeks)
- Implement time interval selector (clock icon, select "last day", "last 8 hours" etc.)
- New settings dialog as a floating dialog box. At the moment, the setting page of the
old history system is used
- Export / Printing / Sending to ELOG any history plot
- Implement a formula for plotting data, such as "y = 12 * (x-14) +32". This will replace
the old "offset" and "factor" and is more flexible. The formula can be passed directly
to the JavaScript engine and will be executed on the web page. It should be also
possible to combine different channels, like the difference of two history values.
- Determine the number of digits for variable display from the axis limits. Like if a value
changes between 520001 and 520002 only, we need more digits than the usual 6.
Many of these things will be implemented in the next weeks. If you have any more idea
or find some bugs, please report back to me.
Best,
Stefan for the midas team |
| Attachment 1: Screenshot_2019-08-14_at_8.50.53_.png
|
|
|
1673
|
06 Sep 2019 |
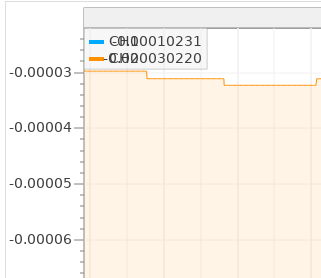
Andreas Suter | Info | New history plot facility | I like the new history system very much, but I stumbled over a couple of issues.
I used the version "Thu Aug 29 08:24:29 2019 +0200 -
midas-2019-06-b-244-gdd6585bb on branch develop":
1) it would be nice to have an option to format the label output (see attachment 1)
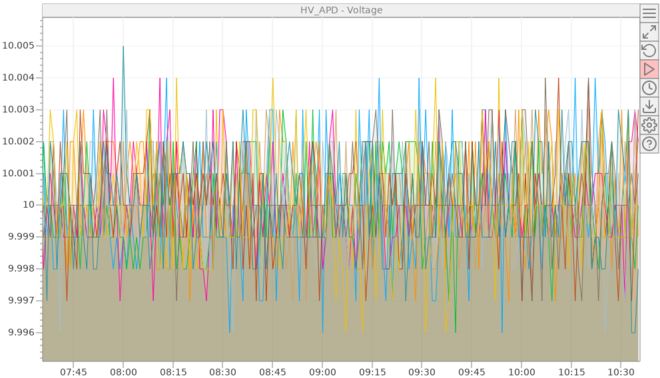
2) the background of a history plot is very handy if you only show one measure.
If you have multiple ones (see attachment 2), this is not the case anymore. It
would be nice if the background could be enabled/disabled.
> During my visit at TRIUMF we rewrote the history plotting functionality of
midas. Instead of
> static GIF images, we have now interactive JavaScript panels where we can
scroll, zoom,
> inspect values and much more (example is attached). We are now in a state
where this is still
> work in progress, but already at this stage it might be useful for others to
report any
> feedback.
>
> Simply upgrade the the newest develop branch of midas, and you will see two
menu items
> "OldHistory" which is the old system and "History" which is the new system. In
the new
> system, you can drag with the mouse to scroll, use the mouse wheel to zoom in
and out the
> time axis, and hover with your mouse over data points to see its value. If you
zoom out,
> old data is loaded automatically in the background.
>
> Following items are planned, but not yet implemented:
>
> - Printing of run markers as in the old history
>
> - Delete old data in the buffer to limit memory consumption if the browser
window is
> open for very long (weeks)
>
> - Implement time interval selector (clock icon, select "last day", "last 8
hours" etc.)
>
> - New settings dialog as a floating dialog box. At the moment, the setting
page of the
> old history system is used
>
> - Export / Printing / Sending to ELOG any history plot
>
> - Implement a formula for plotting data, such as "y = 12 * (x-14) +32". This
will replace
> the old "offset" and "factor" and is more flexible. The formula can be
passed directly
> to the JavaScript engine and will be executed on the web page. It should be
also
> possible to combine different channels, like the difference of two history
values.
>
> - Determine the number of digits for variable display from the axis limits.
Like if a value
> changes between 520001 and 520002 only, we need more digits than the usual 6.
>
> Many of these things will be implemented in the next weeks. If you have any
more idea
> or find some bugs, please report back to me.
>
> Best,
> Stefan for the midas team |
| Attachment 1: label_issue.png
|
|
| Attachment 2: many_labels.png
|
|
|
1674
|
06 Sep 2019 |
Stefan Ritt | Info | New history plot facility | > 1) it would be nice to have an option to format the label output (see attachment 1)
That's clearly a bug, I will fix it.
> 2) the background of a history plot is very handy if you only show one measure.
> If you have multiple ones (see attachment 2), this is not the case anymore. It
> would be nice if the background could be enabled/disabled.
Looking at your plot, even without the background things look messy. Please note
that you can display only a single curve by double clicking on it (and back with Escape).
If all curves are on top of each other, you can get them apart a bit by zooming
in to the vertical axis, then double click. Let ma know if that works for you.
Best regards,
Stefan |
|
1675
|
06 Sep 2019 |
Andreas Suter | Info | New history plot facility | > > 2) the background of a history plot is very handy if you only show one measure.
> > If you have multiple ones (see attachment 2), this is not the case anymore. It
> > would be nice if the background could be enabled/disabled.
>
> Looking at your plot, even without the background things look messy. Please note
> that you can display only a single curve by double clicking on it (and back with Escape).
> If all curves are on top of each other, you can get them apart a bit by zooming
> in to the vertical axis, then double click. Let ma know if that works for you.
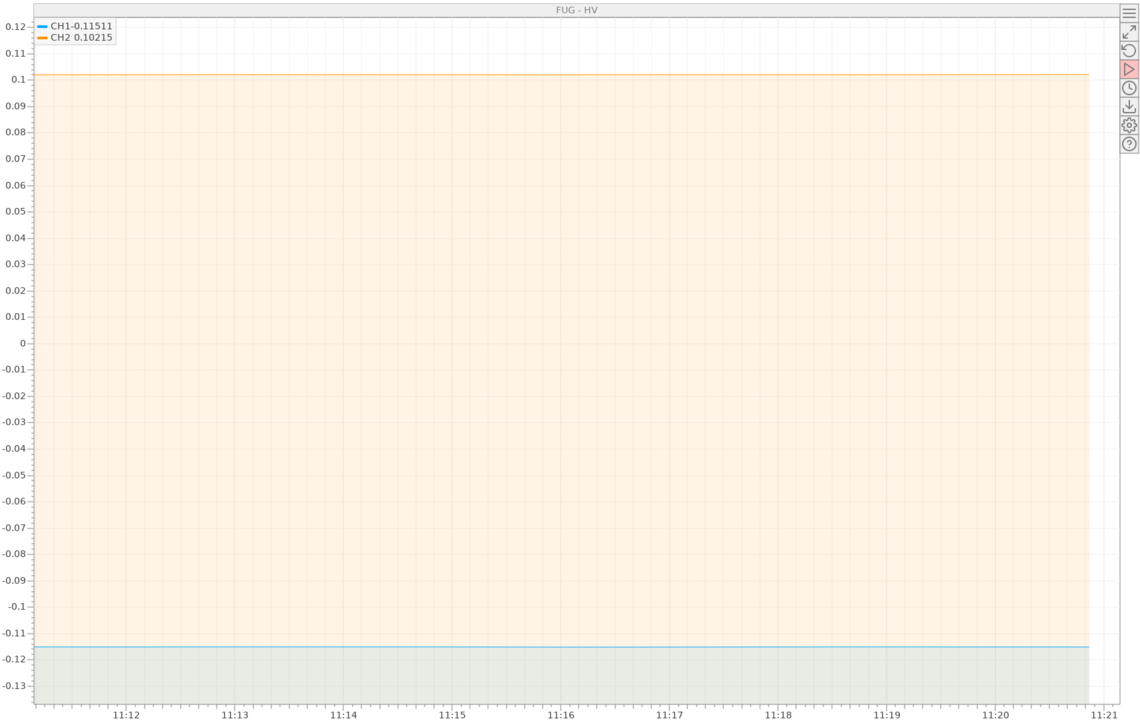
This I found out, yet the attachment here shows another case where it would be useful to be
able to disable the background, namely if you have positive and negative measures in one
plot. Somehow it suggests that CH1 and CH2 show very different values, whereas it is only a
difference in the sign of this variables.
It's not all the important but I would like to mention this is the early stage before
everything is fully frozen. |
| Attachment 1: plot_plus_minus.png
|
|
|
Draft
|
07 Sep 2019 |
Stefan Ritt | Info | New history plot facility | > This I found out, yet the attachment here shows another case where it would be useful to be
> able to disable the background, namely if you have positive and negative measures in one
> plot. Somehow it suggests that CH1 and CH2 show very different values, whereas it is only a
> difference in the sign of this variables.
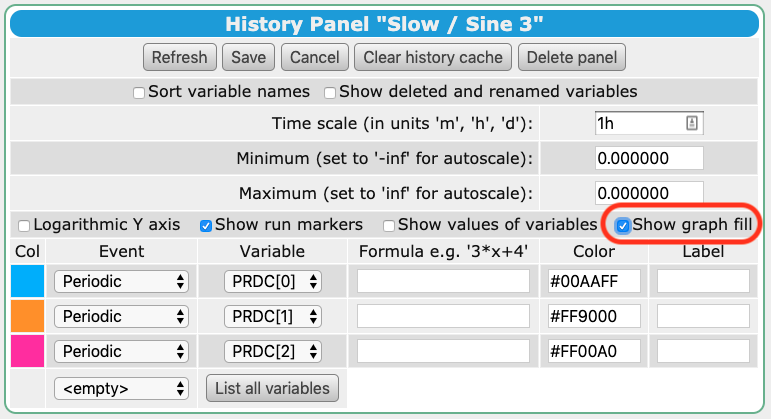
Ok, I added
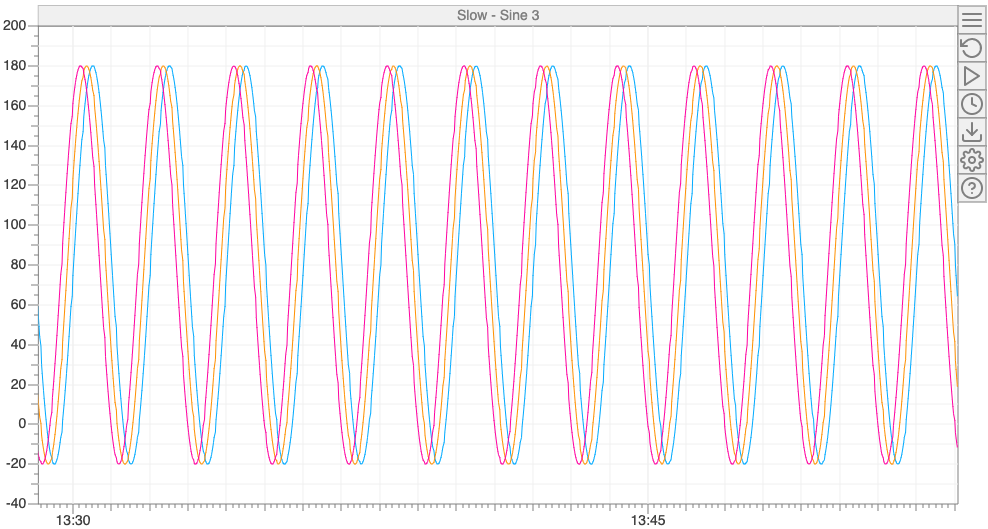
- a correction which does the fill not to the bottom of the window, but only to the y=0 axis.
- a flag "Show graph fille" which lets you turn on and off the filling for each plot
Best,
Stefan |
|
1678
|
07 Sep 2019 |
Stefan Ritt | Info | New history plot facility | > This I found out, yet the attachment here shows another case where it would be useful to be
> able to disable the background, namely if you have positive and negative measures in one
> plot. Somehow it suggests that CH1 and CH2 show very different values, whereas it is only a
> difference in the sign of this variables.
Ok, I added an option which lets you switch off the background.
I also changed the background drawing such that it only goes to the y=0 axis, not the bottom of the screen.
That should help displaying negative values.
Stefan |
| Attachment 1: Screenshot_2019-09-07_at_13.52.49_.png
|
|
| Attachment 2: Slow-Sine_3-20198107-132905-20198107-135305.png
|
|
|
1679
|
08 Sep 2019 |
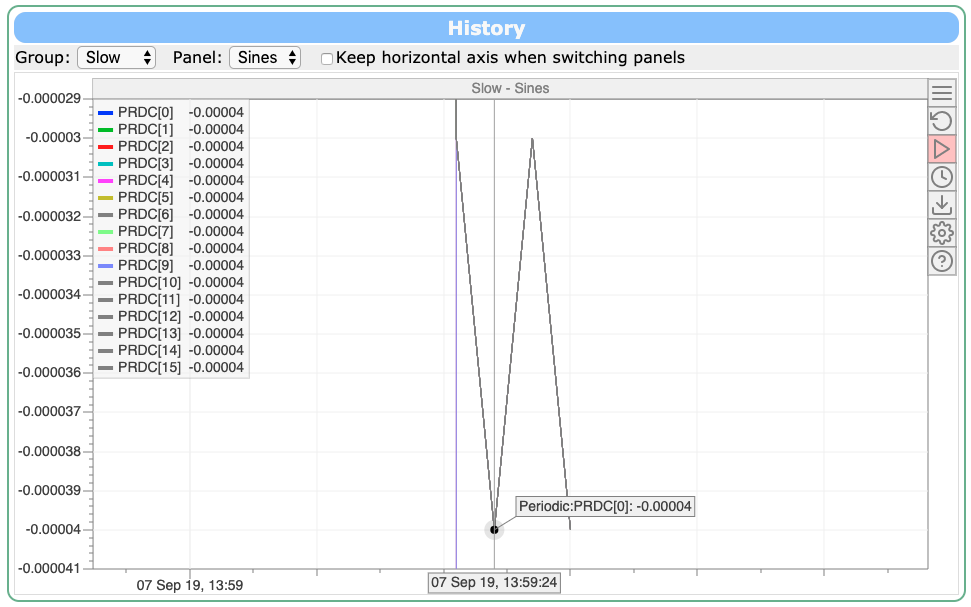
Stefan Ritt | Info | New history plot facility | > 1) it would be nice to have an option to format the label output (see attachment 1)
I fixed that in the current version.
Stefan |
| Attachment 1: Screenshot_2019-09-08_at_12.29.12_.png
|
|
|
1681
|
10 Sep 2019 |
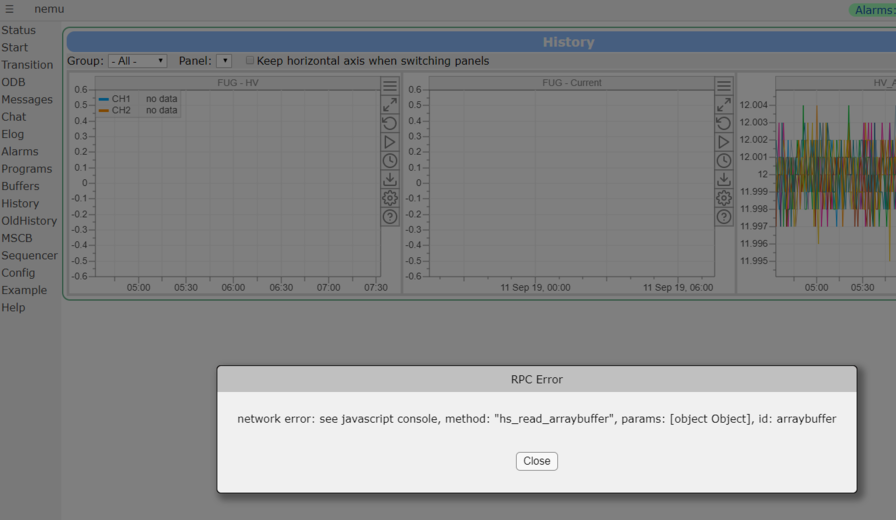
Andreas Suter | Info | New history plot facility | Our typical use case is that a lot of people are connected to the experiment
having some history tabs open most of the time. Hence, I setup a test system and
connect to it from all kind of systems/browsers. What I see currently quite
often is the error hs_read_arraybuffer (see the attachement).
For firefox 60.8.0esr this can result into a full freeze of the tab and only
closing it is possible.
For chromium based browsers you eventually get a popup informing that it is not
responsive anymore.
The worst though is safari 12.1.2 which not only freezes the tab, but
reproducibly crashes the mhttpd on the server side.
Are there ways to get a log which would document where the problems start? |
| Attachment 1: history_hangs.PNG
|
|
|
1682
|
12 Sep 2019 |
Pintaudi Giorgio | Info | History panels in custom pages | > > A new tag has been implemented to display history panels in custom pages, integrated in the
> > new custom page design from 2017. The full documentation can be found at
> >
>
> As part of consolidating/cleaning the MIDAS Wiki documentation, the "New Custom Pages" was folded into the main "Custom Page". So to see a
> description of Stefan's new functionality please go to
>
> https://midas.triumf.ca/MidasWiki/index.php/Custom_Page#mhistory
Hello!
I am trying to use the new mhistory panels in the WAGASCI slow control custom page, but I cannot get them to work.
All I get is an empty frame. Anyway, in the History tab I can see the history plots correctly.
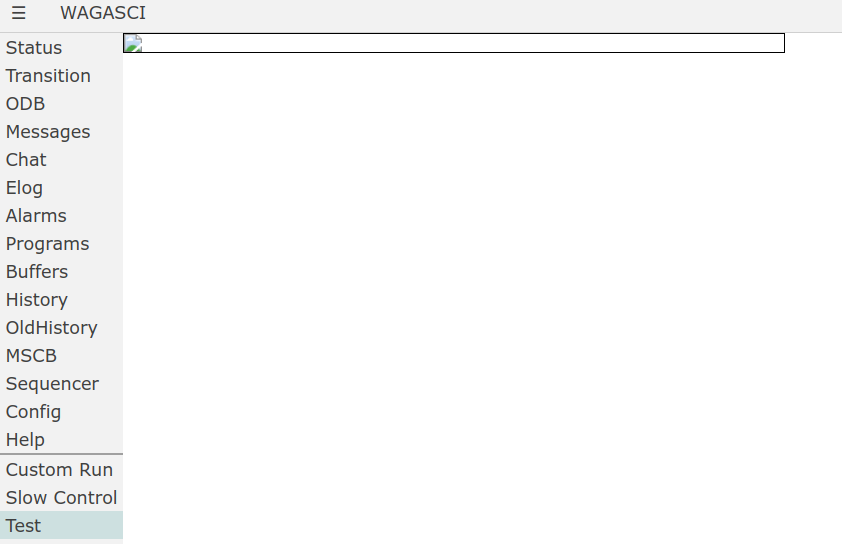
Here is a minimal example:<html>
<head>
<title>Test</title>
<link rel="stylesheet" href="midas.css">
<script src="controls.js"></script>
<script src="midas.js"></script>
<script src="mhttpd.js"></script>
</head>
<body class="mcss" onload="mhttpd_init('Test');">
<div id="mheader"></div>
<div id="msidenav"></div>
<div id="mmain">
<div name="mhistory" data-group="Test" data-panel="Test" data-scale="1m" style="width:600px;border:1px solid black;"></div>
</div>
</body>
</html>
Of course, the "Test" group and "Test" panel exist in the ODB and are correctly shown in the History tab. No error is shown in the console of the web browser.
I am using the latest version of MIDAS as of September 12.
Can you confirm that this feature is working in the latest MIDAS? If yes, how can I troubleshoot the problem?
Regards
Giorgio |
|
1683
|
12 Sep 2019 |
Stefan Ritt | Info | History panels in custom pages | Indeed there was a bug in some JavaScript code, which I fixed here: https://bitbucket.org/tmidas/midas/commits/d2b1a783240e252820c622001e15c09c5d7798c0
Note that your code will bring you the "old style" history panels (with GIF images). If you want the new style (interactive canvas panels), you need the following:
1) Add
<script src="mhistory.js"></Script>
to the top of your custom page
2) Add "mhistory_init();" to the "onload" function of your page, like
<body class="mcss" onloas="mhttpd_init('Example');mhistory_init();">
3) Change the class of the panel from "mhistory" to "mjhistory", like
<div class="mjshistory" data-group=...>
Best regards,
Stefan |
|
1684
|
13 Sep 2019 |
Pintaudi Giorgio | Info | History panels in custom pages | Dear Stefan,
thank you very much for the prompt reply. Your suggestions worked wonderfully. Now I can display all the plots that I want where I want.
The new JavaScript history plots are really a huge improvement over the old ones.
Thank you again
Giorgio
| Stefan Ritt wrote: | Indeed there was a bug in some JavaScript code, which I fixed here: https://bitbucket.org/tmidas/midas/commits/d2b1a783240e252820c622001e15c09c5d7798c0
Note that your code will bring you the "old style" history panels (with GIF images). If you want the new style (interactive canvas panels), you need the following:
1) Add
<script src="mhistory.js"></Script>
to the top of your custom page
2) Add "mhistory_init();" to the "onload" function of your page, like
<body class="mcss" onloas="mhttpd_init('Example');mhistory_init();">
3) Change the class of the panel from "mhistory" to "mjhistory", like
<div class="mjshistory" data-group=...>
Best regards,
Stefan |
|
|
1687
|
16 Sep 2019 |
Konstantin Olchanski | Info | New history plot facility | > I see currently quite often is the error hs_read_arraybuffer (see the
attachement).
> Are there ways to get a log which would document where the problems
start?
> [also crash of mhttpd]
We can debug it from both ends, javascript and mhttpd:
On the web page, the error message says "see javascript console", do you see
anything there?
Or the tab is so hung-up that you cannot even access the console? In this
case, can you open the console before running your test?
In some browsers (firefox, google-chrome) this will also activate the javascript
debugger and as likely as not will make the bug go away (ouch!)
On the mhttpd side, please capture the stack trace from the crash: enable
core dumps (ODB "/experiment/enable core dumps" set to "y", after the crash,
run "ls -l core.*; gdb mhttpd core.9999") or run mhttpd inside gdb or attach
gdb to a running mhttpd (gdb -p 9999). Once in gdb, run "info thr" to list all
threads, "thr 0; bt", "thr 1; bt", etc to get stack traces from all threads, only
one of them contains the crash (tedious!).
Email me the stack trace (or post here), in case we want to look at values
of any variables from the crash, keep the core dump and do not rebuild
mhttpd.
K.O. |
|
1688
|
16 Sep 2019 |
Konstantin Olchanski | Info | New history plot facility | > During my visit at TRIUMF we rewrote the history plotting functionality of midas.
This is a most amazing achievement. We wanted to do this "for years" and I think we have
benefitted greatly from the delay - tools available for building interactive web graphics
have improved so much so recently.
For example, delivering binary data from mhttpd to javascript (avoiding json encoding and decoding
saves tons of CPU cycles) went from "how do I do this?!?" to "I did it in only 3 hours!".
> We are now in a state where this is still work in progress, but already at this stage it might
> be useful for others to report any feedback.
The old gif-based history plots took a lot of effort and a long time to get where they work well
for most experiments and where we are happy with them.
From the TRIUMF side of things, lots of polishing of the graphics and of the user interface came
through use at our bigger experiments - TWIST (TRIUMF), ALPHA (CERN), T2K/ND280 (Japan).
So, much improvement and polishing of the new graphics is still ahead for us.
> Simply upgrade the the newest develop branch of midas, and you will see two menu items
> "OldHistory" which is the old system and "History" which is the new system.
I hope to start the new release branch for midas-2019-09 soon. For the release, we will try
to have both the old and the new history graphics to integrate smoothly. The old graphics
still has to work well, as some users may prefer the old graphics and the old user interface.
Also the new system is still incomplete, i.e. there is no trivial way to save a history plot into a file:
> Following items are planned, but not yet implemented:
> - Printing of run markers as in the old history
> - Export / Printing / Sending to ELOG any history plot
K.O. |
|
1690
|
16 Sep 2019 |
Stefan Ritt | Info | New history plot facility | > Also the new system is still incomplete, i.e. there is no trivial way to save a history plot into a file:
That has been implemented in meantime. Just click on the download arrow and you can save the current window in CSV or PNG format.
Stefan |
|
1694
|
17 Sep 2019 |
Andreas Suter | Info | New history plot facility | > On the mhttpd side, please capture the stack trace from the crash: enable
> core dumps (ODB "/experiment/enable core dumps" set to "y", after the crash,
> run "ls -l core.*; gdb mhttpd core.9999") or run mhttpd inside gdb or attach
> gdb to a running mhttpd (gdb -p 9999). Once in gdb, run "info thr" to list all
> threads, "thr 0; bt", "thr 1; bt", etc to get stack traces from all threads, only
> one of them contains the crash (tedious!).
>
> Email me the stack trace (or post here), in case we want to look at values
> of any variables from the crash, keep the core dump and do not rebuild
> mhttpd.
>
> K.O.
here comes the stack trace (only happens when using safari 12.1.2 macOS 10.14.6):
(gdb) thr 1
[Switching to thread 1 (Thread 0x7f57ceffd700 (LWP 3538))]
#0 0x00007f57f29fe377 in raise () from /lib64/libc.so.6
(gdb) bt
#0 0x00007f57f29fe377 in raise () from /lib64/libc.so.6
#1 0x00007f57f29ffa68 in abort () from /lib64/libc.so.6
#2 0x00007f57f330e7d5 in __gnu_cxx::__verbose_terminate_handler() () from
/lib64/libstdc++.so.6
#3 0x00007f57f330c746 in ?? () from /lib64/libstdc++.so.6
#4 0x00007f57f330c773 in std::terminate() () from /lib64/libstdc++.so.6
#5 0x00007f57f330c993 in __cxa_throw () from /lib64/libstdc++.so.6
#6 0x00007f57f330cf2d in operator new(unsigned long) () from /lib64/libstdc++.so.6
#7 0x00007f57f336ba19 in std::string::_Rep::_S_create(unsigned long, unsigned long,
std::allocator<char> const&)
() from /lib64/libstdc++.so.6
#8 0x00007f57f336c62b in std::string::_Rep::_M_clone(std::allocator<char> const&,
unsigned long) ()
from /lib64/libstdc++.so.6
#9 0x00007f57f336ccfc in std::basic_string<char, std::char_traits<char>,
std::allocator<char> >::basic_string(std::string const&) () from /lib64/libstdc++.so.6
#10 0x000000000041ce0f in check_digest_auth (hm=hm@entry=0x7f57ceffc520, auth=0x74b060
<auth_mg>)
at /home/nemu/nemu/tmidas/midas/progs/mhttpd.cxx:17143
#11 0x0000000000452a61 in handle_http_message (msg=0x7f57ceffc520, nc=0x2019ca0,
this=<optimized out>,
this=<optimized out>, this=<optimized out>) at
/home/nemu/nemu/tmidas/midas/progs/mhttpd.cxx:17703
#12 handle_http_event_mg (nc=nc@entry=0x2019ca0, ev=ev@entry=100,
ev_data=ev_data@entry=0x7f57ceffc520)
at /home/nemu/nemu/tmidas/midas/progs/mhttpd.cxx:17753
#13 0x0000000000464c4b in mg_call (nc=nc@entry=0x2019ca0,
ev_handler=0x4521f0 <handle_http_event_mg(mg_connection*, int, void*)>, ev=100,
ev_data=ev_data@entry=0x7f57ceffc520) at
/home/nemu/nemu/tmidas/midas/progs/mongoose6.cxx:2120
#14 0x000000000046790e in mg_http_call_endpoint_handler (nc=nc@entry=0x2019ca0,
ev=<optimized out>,
hm=hm@entry=0x7f57ceffc520) at /home/nemu/nemu/tmidas/midas/progs/mongoose6.cxx:4946
#15 0x0000000000467e3f in mg_http_handler (nc=nc@entry=0x2019ca0, ev=ev@entry=3,
ev_data=ev_data@entry=0x7f57ceffcb2c) at
/home/nemu/nemu/tmidas/midas/progs/mongoose6.cxx:5139
#16 0x0000000000464c4b in mg_call (nc=nc@entry=0x2019ca0,
ev_handler=0x467a20 <mg_http_handler(mg_connection*, int, void*)>,
ev_handler@entry=0x0, ev=ev@entry=3,
ev_data=ev_data@entry=0x7f57ceffcb2c) at
/home/nemu/nemu/tmidas/midas/progs/mongoose6.cxx:2120
#17 0x0000000000464fb7 in mg_recv_common (nc=nc@entry=0x2019ca0,
buf=buf@entry=0x7f57c0000cd0, len=len@entry=279)
at /home/nemu/nemu/tmidas/midas/progs/mongoose6.cxx:2676
#18 0x00000000004659c8 in mg_if_recv_tcp_cb (len=279, buf=0x7f57c0000cd0, nc=0x2019ca0)
at /home/nemu/nemu/tmidas/midas/progs/mongoose6.cxx:2680
#19 mg_read_from_socket (conn=0x2019ca0) at
/home/nemu/nemu/tmidas/midas/progs/mongoose6.cxx:3378
#20 mg_mgr_handle_conn (nc=0x2019ca0, fd_flags=1, now=now@entry=1568705761.3290441)
at /home/nemu/nemu/tmidas/midas/progs/mongoose6.cxx:3511
#21 0x0000000000465ee0 in mg_mgr_poll (mgr=mgr@entry=0x7f57ceffcda0,
timeout_ms=timeout_ms@entry=1000)
at /home/nemu/nemu/tmidas/midas/progs/mongoose6.cxx:3687
#22 0x0000000000466085 in per_connection_thread_function (param=0x2019ca0)
at /home/nemu/nemu/tmidas/midas/progs/mongoose6.cxx:3805
#23 0x00007f57f39c7ea5 in start_thread () from /lib64/libpthread.so.0
#24 0x00007f57f2ac68cd in clone () from /lib64/libc.so.6 |
|