 02 Apr 2008, Konstantin Olchanski, Info, add "const" attributes to db_xxx() functions 02 Apr 2008, Konstantin Olchanski, Info, add "const" attributes to db_xxx() functions
|
Now that we use more and more C++, lack of "const" attribute on most midas functions is causing some
problems. I am now ready to commit changes to midas.h and odb.c that add the const attributes to ODB
access functions db_xxx(), i.e.
INT db_rename_key(HNDLE hDB, HNDLE hKey, char *name)
becomes
INT db_rename_key(HNDLE hDB, HNDLE hKey, const char *name)

If we proceed with this conversion, and it does not cause major havoc, I can continue and "const"ify the
rest of midas.h. I note that the mxml functions appear to already have the correct "const" declarations.

P.S. Adding the "const" attribute caught a few places where we were modifying a "char*" string passed by
the caller. This is undesirable if we are passed a string literal, i.e. db_rename_key(...,"foo"), and it is a
complete disaster in conjunction with C++ strings, i.e. db_rename_key(...,foo.c_str())

K.O. |
 03 Apr 2008, Stefan Ritt, Info, add "const" attributes to db_xxx() functions 03 Apr 2008, Stefan Ritt, Info, add "const" attributes to db_xxx() functions
|
> Now that we use more and more C++, lack of "const" attribute on most midas functions is causing some
> problems. I am now ready to commit changes to midas.h and odb.c that add the const attributes to ODB
> access functions db_xxx(), i.e.
> INT db_rename_key(HNDLE hDB, HNDLE hKey, char *name)
> becomes
> INT db_rename_key(HNDLE hDB, HNDLE hKey, const char *name)
>
> If we proceed with this conversion, and it does not cause major havoc, I can continue and "const"ify the
> rest of midas.h. I note that the mxml functions appear to already have the correct "const" declarations.
>
> P.S. Adding the "const" attribute caught a few places where we were modifying a "char*" string passed by
> the caller. This is undesirable if we are passed a string literal, i.e. db_rename_key(...,"foo"), and it is a
> complete disaster in conjunction with C++ strings, i.e. db_rename_key(...,foo.c_str())

I fully approve your idea. You are absolutely right that it also will help to prevent errors such as modifying
fixed strings. I was just too lazy to do that, because it requires some additional code like:

func(const char *p)
{
char str[256];

  strlcpy(str, p, sizeof(str));
  strlcat(str, ...)
}

So if you do it, it's great! |
|
03 Apr 2008, Konstantin Olchanski, Info, add "const" attributes to db_xxx() functions
|
> > I am now ready to commit changes to midas.h and odb.c that add the const attributes to ODB
> > access functions db_xxx(), i.e.
> > INT db_rename_key(HNDLE hDB, HNDLE hKey, char *name)
> > becomes
> > INT db_rename_key(HNDLE hDB, HNDLE hKey, const char *name)
>
> I fully approve your idea.

Committed revision 4172.

K.O. |
|
30 Apr 2008, Konstantin Olchanski, Info, triumf elog updated to elog-2.7.3-1.i386.rpm
|
FYI - in conjunction with replacement of ladd00.triumf.ca, this MIDAS ELOG has been updated to the latest
version 2.7.3-2058. Please report any problems or anomalies. K.O. |
|
28 May 2008, Konstantin Olchanski, Info, Roll-back for history sytem added
|
> > But to make things more interesting we had another history outage this week...
> > Anyhow, I now have a patch to allow hs_read() to "skip the bad spots" in history files.
>
> [Stefan suggested]
>
>   if ((irec.time - last_irec_time) > 3600*24)


Yes, your stronger check works quite nicely. The whole patch is now committed into SVN,
revision 4202.

This is how it all works:

0) teach hs_gen_index() to skip over bad data. This is important because hs_read() only
looks at data records listed in the index file: if bad data is omitted from the index,
hs_read() will never see it and we do not need to worry about it in hs_read().
0a) because hs_gen_index() does not check validity of time stamps, we still need to check
them in hs_read().
1) in hs_read(), if we detect bad data (invalid headers, bad time stamps, etc), we
regenerate the index files - this removes a while class of bad data. We also look at time
stamps carefully and ignore records where time goes backwards (usually bad data) and ignore
records with time in the future beyound the end of the current history file (each history
file only contains 24*60*60 seconds = 1 day's worth of data).

While certainly not bullet-proof, these changes should make it easier to deal with
corruption of history files.

K.O. |
17 Jun 2008, Stefan Ritt, Info, Improvement of custom pages 
|
Some improvement of custom pages have been implemented. The idea behind is that
a custom page would contain a large background image containing indicators but
also controls. While indicators (values, bars) are already available, the field
of controls have been improved.

Edit boxes floating on top of a graphic
---------------------------------------

The first option has been there from the beginning, but was never documented. It
makes it possible to put an edit box right on top of a graphic by means of a CSS
style tag. The custom page code could look like this:

<div style="position:absolute; top:100px; left:50px;">
<odb src="/Runinfo/run number" edit=1>
</div>
<img src="cusgom.gif">

The "div" tag surrounding the "odb" tag places this directly on top of the
"custom.gif" image, where it can be clicked to be edited.

Password protection of an edit box
----------------------------------

Being able to control an experiment through a web interface of course rises the
question about safety. This is not so much about external access (for which we
have other protection schemes like host lists etc.) but it's about accidental
access by the normal shift crew. If a single click on a web page opens a
critical valve, this might be a problem. In order to restrict access to some
"experts", an additional password can be chosen for all or some controls on a
custom page. This is done by a new option in the "odb" tag and by adding a small
JavaScript function into the custom page:

<script type="text/javascript">
<!--
function promptpwd(path)
{
    pwd = prompt('Please enter password', '');
    document.cookie = "cpwd=" + pwd;
    location.href = path;
}
//-->
</script>

...

<odb src="/..." edit=1 pwd="CustomPwd">

...

If the "pwd" option is present in the "odb" tag, mhttpd establishes a call to
the promptpwd() function if one click on the value. The password is then asked
from the user and submitted as a cookie. mhttpd then check this password against
the ODB entry

/Custom/Pwd/CustomPwd

and shows an error if they don't match. By using an explicit name ("CustomPwd"
in the above example) one can use a single password for all controls on a page,
or one could use several passwords on the same page. Like a shift crew password
for the less severe controls (/Custom/Pwd/ShiftPwd), and an "expert" password
(/Custom/Pwd/ExpertPwd) for the critical things. This password is of course not
secure in the sense that it's placed in plain text into the ODB, it's more to
prevent accidental modifications of things.

Area map to toggle values
-------------------------

Sometimes it's desirable to toggle a value, like the state of a valve. This can
be done now with a new function like this:

<map name="Custom1">
<area shape="rect" coords="40,200,100,300" alt="Main Valve"
  href="Custom1?cmd=Toggle&odb=/Equipment/Environment/Variables/Output[2]">
</map>
<img src="cusgom.gif" usemap="#Custom1">

This defines a clickable map on top of the custom image. The area(s) should
match with some areas on the image like the box of a valve. By clicking on it,
the supplied path to the ODB is used (in this case
"/Equpiment/Environment/Variables[2]") and it's value is toggled (set to 0 if it
is 1, set to 0 if it is 1). If the valve value is then used in the image via a
"fill" statement to change the color of the valve, it can turn green or red
depending on it's state.

Are map with password check
---------------------------

The above area map can be combined with the password check. To do so, one needs:

<area shape="rect" coords="40,200,100,300" alt="Main Valve"
  href="#"
onClick="promptpwd('Custom1?cmd=toggle&pnam=CustomPwd?odb=/Equipment/Environment/Variables/Output[2]')">

in combination with the JavaScript from above.


An example of the are map technology is shown in the attachment. This page from the MEG experiment at PSI
shows a complex gas system. The valves are represented as green circles. If they are clicked, they close
and become red (after the user successfully supplied the correct password). |
|
04 Jul 2008, Stefan Ritt, Info, Improved alarm conditions implemented
|
I implemented improved alarm conditions in the alarm system. Now one can write
conditions like

  /Equipment/HV/Variables/Input[*] < 100

or

  /Equipment/HV/Variables/Input[2-3] < 100

to check all values from an array or a certain range. If one array element
fulfills the alarm condition, the alarm is trigger. In addition, bit-wise alarm
conditions are possible

  /Equipment/Environment/Variables/Input[0] & 8

is triggered if bit #2 is set in Input[0].

The changes are committed to SVN revision 4242. |
|
16 Jul 2008, Stefan Ritt, Info, Implementation of db_set_link_data() and db_set_link_data_index()
|
The current implementation of ODB links has the problem that once a link is
created, it cannot be changed any more through odbedit. This is because each
"set" command works on the destination of the link instead of the link. The same
happens when one loads a *.odb file. To overcome this problem, two new functions
db_set_link_data() and db_set_link_data_index() have been implemented. They
resemble their counterparts db_set_data() and db_set_data_index(), but they can
be used to directly modify a link instead of the link target. I use these
functions now in odbedit and db_paste() so that the above described problems are
fixed now. I do not expect any side effect of this, but if people experience
problems with db_paste(), please let me know. |
|
31 Jul 2008, Stefan Ritt, Info, Improvement of custom pages
|
Even more improvements have been implemented into custom pages recently, containing a complete JavaScript library for ODB communication. This JavaScript library relies on certain new commands built into mhttpd, and is therefore hardcoded into mhttpd. It can be seen by entering
http://<your mhttpd host>/mhttpd.js
To include it in your custom page, put following statement inside the <head>...</head> tag:
<script type="text/javascript" src="../mhttpd.js"></script>
It contains several functions:
Display of cursor location
When writing custom pages with large background images and labels placed on that image, it is hard to figure out X and Y coordinates of the labels. This can now be simplified by adding a new tag to the background image like
<img id="refimg" src="...">
If the "refimg" tag is present, the cursor changes into a crosshair and it's absolute and relative locations in respect to the reference image are shown in the status bar:
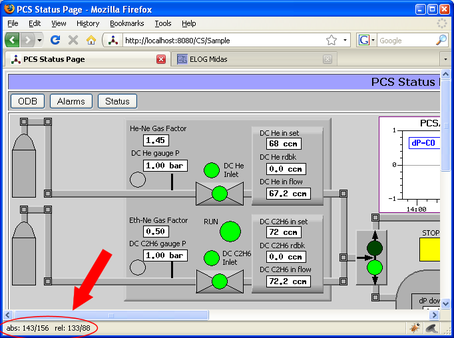
To make this work under Firefox, the user has to explicitly allow for status bar changes. To do so, enter about:config in the address bar. In the filter bar, enter status. Then locate dom.disable_window_status_change and set it to false.
Retrieving ODB values
Retrieving individual or array values from the ODB through the AJAX interface is now very simple. Just call:
ODBGet(<path>);
to obtain a value. If <path> points to an array in the ODB, an individual value can be retrieved by using an index, like
ODBGet('/Equipment/Environment/Variables/Input[3]');
or the complete array can be obtained with
ODBGet('/Equipment/Environment/Variables/Input[*]');
The function then returns a JavaScript array which can be used like
  var a = ODBGet('/Equipment/Environment/Variables/Input[*]');

  for (i=0 ; i<a.length ; i++)
    alert(a[i]);
This functionality together with the window.setInterval() function can be used to update parts of the web page periodically such as:
  window.setInterval("Refresh()", 10000);

  function Refresh() {
    document.getElementById("run_number").innerHTML = ODBGet('/Runinfo/Run number');
  }
This function updates the current run number every 10 seconds in the background. The custom page has to contain an element with id="run_number", such as
<td id="run_number"></td>
The formatting of any number uses the internal default. If this should be changed, the format can directly appended in the ODB path such as:
ODBGet('/Equipment/Environment/Variables/Input[3]&format=%1.2lf');
the format %1.2lf is then directly passed to the sprintf() function.
Retrieving System Messages
A similar function ODBGetMsg(<n>) has been defined. It retrieves the last <n> system messages, which can then be displayed in some message area. If n=1 a single string is returned, if n>1 an array of strings is returned similar to ODB arrays.
Setting ODB values
Individual ODB values can be set in the background with
ODBSet(<path>,<value>);
or
ODBSet(<path>,<value>,<password_name>);
The password_name has the same meaning as described in elog:492. It must be defined under /Custom/Pwd/<password_name>. The function ODBSet can be used for example when one clicks on an checkbox for example:
<input type="checkbox" onClick="ODBSet('/Logger/Write data',this.checked?'1':'0')">
If used as above, the state of the checkbox must be initialized when the page is loaded. This can be either done with some JavaScript code called on initialization, which then uses ODBGet() as described above. Alternatively, the <odb> tag can be used like:
<odb src="/Logger/Write data" type="checkbox" edit="2" onclick="ODBSet('/Logger/Write data',this.checked?'1':'0')">
The special code edit="2" instructs mhttpd not to put any JavaScript code into the checkbox tag, since setting this value in the ODB is now handled by the user-supplied ODBSet() code. With edit="1" the internal JavaScript is activated, which uses the old form submission for sending the value to the ODB. |
|
28 Aug 2008, Konstantin Olchanski, Info, triumf/t2k midas updates
|
Following changes to midas produced from the TRIUMF T2K project have been
committed to svn:
1) cm_shutdown() will now SIGKILL clients that cannot be stopped via normal
means. Previously cm_shutdown() would print a message to the effect "please kill
this client yourself manually". The user action in this case (assuming they did
not issue cm_shutdown() by mistake) has been to find out the client pid using
"ps", kill -KILL it, then "odbedit clean". cm_shutdown() now performs all this
automatically.
2) rpc_send_event() did not correctly detect loss of connection to the remote
mserver (i.e. in case it was killed by cm_shutdown() above). Now, correct error
handling is in place and the remote frontend should gracefully shutdown if
mserver connection is lost. (However I observe that some of my remote frontends
fail to exit unless I do "exit(1);" from my frontend_exit() function.
3) mhttpd bug fixed: when editing odb entries, the "cancel" button did not work
correctly.
4) lazylogger "script" backup type is now fully tested and documented. Example
scripts for writing to dcache are available by request.
5) mlogger and mhttpd changes for writing history data to an sql database are
mostly completed and will be committed after some more debugging. (If you are
interested in details, please contact me directly).
6) (committed some time ago) Makefile changes for cross-compiling midas are now
in: "make linux32", "make linux64", "make crosscompile".
K.O. |
|
29 Aug 2008, Konstantin Olchanski, Info, history_odbc: store MIDAS history in ODBC/MySQL database
|
The code for storing midas history in an odbc sql database has been committed.
Changes:
include/history_odbc.h, src/history_odbc.cxx --- implementation
src/mlogger.c --- call the history_odbc functions
utils/mh2sql.cxx --- import existing midas history files (*.hst) into an odbc
sql database.

This new code is enabled by the HAVE_ODBC gunk in the Makefile. If compilation
bombs, please let me know and as a work around, comment out all instances of
HAVE_ODBC from your Makefile.

Limitations:
- mhttpd support for reading history data from odbc sql database is missing
- many sql functions are implemented in a very minimalistic form (i.e. when
defining a history event, we blindly ask sql to create the tables, even if they
already exist - this works, but spams the midas log with sql errors).
- error handling is incomplete: after any sql error, the odbc connection is closed.
- only MySQL (and ascii output) are supported: we use mysql-specific data types
as they match midas types exactly. Code to support PgSQL is present and it used
to work, but is commented out. (At TRIUMF/T2K, we intend to use MySQL exclusively).
- ODBC ascii interface is used, instead of the potentially more efficient binary
interface.

To enable:
- create a MySQL database,
- create $HOME/.odbc.ini (see attached example)
- set ODB "/History/PerVariableHistory" to "1" - the new code is intended to be
used with per-variable history. Per-equipment (traditional) history would work,
but will result in suboptimal layout of SQL tables.
- set ODB "/Logger/ODBC_DSN" to the DSN defined in .odc.ini.
- set ODB "/Logger/ODBC_Debug" to non-zero to enable debugging output from the
new code.

To use the "ascii output" mode:
Included is code to write "ascii" sql output into a text file, instead of using
an actual SQL database. To enable it, set "ODBC_DSN" to
"/path/to/some/text/file" and all SQL output will be written to this file. No
actual SQL database required. This mode exists mostly for debugging the SQL syntax.

Despite limitations, the committed code is fully functional - we are presently
using it to record history data from slow controls of T2K detector tests
(voltages, currents, temperatures).

Comments and suggestions on naming and mapping from odb structures to SQL tables
is very much welcome.

K.O. |
|
18 Sep 2008, Stefan Ritt, Info, New flag for auto restart
|
A new ODB flag has been introduced. When the logger is configured for automatic
stop and restart (/Logger/Auto restart = y), the restart delay was hard-wired
to 20 sec., which might be too long or short for some experiments. Therefore a
new parameter "/Logger/Auto restart delay" has been introduced which can be
used to accommodate different delays. A non-zero delay is necessary for
experiments where some lengthy activities occur during the stop of a run, like
an analyzer writing many histograms to disk. |
|
18 Sep 2008, Stefan Ritt, Info, Potential problems in multi-threaded slow control front-end
|
We had recently some problems at our experiment which I would like to share
with the community. This affects however only experiments which have a slow
control front-end in multi-threaded mode.

The problem is related with the fact that the midas API is not thread safe, so
a device driver or bus driver from the slow control system may not call any ODB
function. We found several drivers (mainly psi_separator.c, psi_beamline.c etc)
which use inside read/write function the midas PAI function cm_msg() to report
any error. While this is ok for the init section (which is executed in the main
frontend thread) this is not ok for the read/write function inside the driver.
If this is done anyhow, it can happen that the main thread locks the ODB (via
db_lock_database()) and the thread interrupts that call and locks the ODB
again. In rare cases this can cause a stale lock on the ODB. This blocks all
other programs to access the ODB and the experiment will die loudly. It is hard
to identify, since error messages cannot be produced any more, and remote
programs (not affected by the lock) just show a rpc timeout.

I fixed all drivers now in our experiment which solved the problem for us, but
I urge other people to double check their device drivers as well.

In case of problems, there is a thread ID check in
db_lock_database()/db_unlock_database() which can be activated by supplying

-DCHECK_THREAD_ID

in the compile command line. If then these functions are called from different
threads, the program aborts with an assertion failure, which can then be
debugged.

There is also a stack history system implemented with new functions
ss_stack_xxxx. Using this system, one can check which functions called
db_lock_database() *before* an error occurs. Using this system, I identified
the malicious drivers. Maybe this system can also be used in other error
debugging scenarios. |
|
19 Sep 2008, Stefan Ritt, Info, Lazylogger logging changed
|
I modified the logging behavior of lazylogger. Originally, it was writing
messages (run copied, removed, ...) both into midas.log and
lazy_log_update.log. Since we have many files, it kind of clutters up the
logging files. I think it is a good idea to have a separate file (which I
changed not to "lazy.log" instead of "lazy_log_update.log" which I guess was a
bug), so I put the logging into the main file under a conditional compile:

#ifdef WRITE_MIDAS_LOG
   cm_msg(MINFO, "lazy_log_update", str);
#endif

so it can be turned on again by adding -DWRITE_MIDAS_LOG to the compile line.
If other experiments have different needs, one could make the logging behavior
controllable through the ODB. In that case, I would suggest a single parameter
"Logging file" which can be either "midas.log" for the normal logging or
"lazy.log" for logging into the extra file. I guess having the messages twice
on the system is not needed by any experiment.

- Stefan |
|
03 Oct 2008, Konstantin Olchanski, Info, Implement non-default mserver tcp port numbers.
|
midas revision 4342 implements non-default tcp port numbers for the mserver.

To use, run "mserver -p 7070" and say "setenv MIDAS_SERVER_HOST
host.example.com:7070".

This is useful when multiple experiments share the same computer, but one does
not want to setup a global /etc/exptab (non-root users cannot change it) or one
does not want to run the mserver from xinetd (i.e. all experiments run different
versions of midas and cannot use the same common mserver executable).

Changed files:
src/mserver.c
src/midas.c
doxfiles/utilities.dox
doxfiles/appendixD.dox

Revision 4342.

K.O. |
|
13 Oct 2008, Stefan Ritt, Info, mhttpd multi-experiment support removed
|
Previously, one mhttpd server could sever several experiments at the same time.
This caused however sometimes problems and was hard to maintain. Starting from
SVN revision 4348, I removed the multi-experiment support, which I believe is
now a much cleaner implementation. So if several experiments are defined on a
computer, each one need a separate mhttpd process listening on a different
port. The experiment name can now be supplied on the command line to mhttpd
like for any other midas program. I have tested this so far at two experiments
at PSI, but this does not cover all possibilities. What I did not try was
experiments with web passwords and odb passwords. If there is any problem after
upgrading to 4348, please report. |
|
13 Oct 2008, Konstantin Olchanski, Info, MIDAS drivers for Tundra tsi148 pci-vme bridge
|
The latest midas mvmestd.h driver for the Tundra tsi148 pci-vme bridge as used
on GEFANUC VME processors have been commited, revision 4349.

This midas drivers require the "gefvme" Linux kernel driver supplied by GEFANUC
as part of their Linux BSP. (Note that version "v7865-sdk-linux-R01.00" from
GEFANUC is mostly non-functional).

At TRIUMF have the V7865 VME processors and use the kernel driver
v7865-sdk-linux-R01.00-KO6. This driver supports these functions:

1) memory mapped access to full VME A16 and A24 address spaces and window-mapped
access to VME A32 address space. (original gefvme driver does not do
memory-mapped access)
2) DMA directly from vme to user memory, with support for multi-segment chained
transfers (original gefvme driver lacks chained transfers)
3) DMA from user memort to vme should work but is untested
4) no support for interrupts (original gefvme driver does not interrupts).

If you are interested in in using the TRIUMF driver, please contact me directly.

If you already purchased the GEFANUC BSP, I think you can use my drivers
immediately, without objection from GEFANUC.

Otherwise, I will have to do some research into the gefvme code license: since
all of the code appears to have GPL headers and identical code exists on the
internet, I expect to find that my gefvme driver can be freely distributed under
the GPL. But until then, and until it is cleared with TRIUMF management, I
cannot make my gefvme driver available for free download.

K.O. |
|
17 Oct 2008, Konstantin Olchanski, Info, mlogger async transitions, etc
|
As we were looking into problems with starting and stopping runs in one of our
daq systems, we found that the mlogger does something differently compared to
mhttpd and odbedit. Starting and stopping runs from mhttpd and odbedit works
correctly, but runs restarted by the file size limit in mlogger would often have
problems.

It turns out that mlogger calls cm_transition() with the ASYNC flag, while
mhttpd and odbedit always use SYNC.

The best I can tell, the ASYNC flag tells cm_transition() to fire off the
end-run rpc calls to all clients all at once, without waiting for reply from the
previous client before calling the next one. This effectively defeats the
transition sequence numbers - higher-numbered clients are told to end-run before
the lower-numbered clients have finished their end-run processing.

Most of the time, transition sequence numbers do not matter - all frontends can
stop at the same time, only mlogger has to be the very last, and for transitions
initiated by the mlogger itself, this sequencing is preserved.

It turns out that for our system, correct sequencing of individual frontends is
important, for example, the frontend controlling the trigger system has to stop
first. As we are using correctly adjusted transition sequence numbers, the right
sequence is always done when runs are started/stopped from mhttpd and from
odbedit, but not for runs started/stopped by the mlogger.

So by changing mlogger to always do SYNC transitions, we fixed our sequencing
problem - now runs always start and stop correctly.

But then we ran into a deadlock between the mlogger and the event builder:

1) mlogger wants to stop the run
2a) mlogger stops reading the SYSTEM buffer
2b) mlogger starts cm_transition(SYNC)
3) rpc call to trigger frontend, trigger is blocked (no new events are
generated, but existing data is still flowing through the system)
4) other frontends are stopped (data still flowing)
5) data still flowing through the system, into the event builder, into the
SYSTEM buffer
6) SYSTEM buffer becomes 100% full (mlogger is not reading it, it is busy inside
cm_transition()), event builder is waiting for free space inside bm_send_event()
7) mlogger issues end-run rpc call to event builder
8) deadlock: mlogger is waiting for a reply from the event builder, the event
builder is waiting for free space in the SYSTEM buffer (not processing rpc
calls), mlogger is supposed to empty the SYSTEM buffer, but it is waiting for an
rpc reply instead.

In our particular case, the dead lock was easy to avoid by making the SYSTEM
buffer big enough to accommodate all in-flight data, but the problem remains in
the general case. I suspect mlogger uses ASYNC transactions exactly to avoid
this type of deadlock (mlogger used ASYNC transactions since svn revision 2, the
beginning of time).

Personally, I am not happy about the inconsistency of run sequencing between
mlogger and mhttpd/odbedit (hmm... should also check mfe.c, it also stops runs
based on event count limits, etc). I think it would be better if all programs
did the same exact thing when starting/stopping runs. When mlogger does
something different, we get surprising unexpected behaviour, best avoided.

One possible solution could be to add an odb variable "/logger/async
transitions", set to "false" by default - to be consistent with other programs.
Systems that benefit from the old ASYNC behaviour and do not care about exact
sequencing can set this flag to "true".

K.O. |
|
18 Oct 2008, Stefan Ritt, Info, mlogger async transitions, etc
|
> I suspect mlogger uses ASYNC transactions exactly to avoid
> this type of deadlock (mlogger used ASYNC transactions since svn revision 2, the
> beginning of time).

That's exactly the case. If you would have asked me, I would have told you
immediately, but it is also good that you re-confirmed the deadlock behavior with
the SYNC flag. I didn't check this for the last ten years or so.

Making the buffers bigger is only a partial solution. Assume that the disk gets
slow for some reason, then any buffer will fill up and you get the dead lock.

The only real solution is to put the logic into a separate thread. So the thread
does all the RPC communication with the clients, while the main logger thread logs
data as usual in parallel. The problem is that the RPC layer is not yet completely
tested to be thread safe. I put some mutex and you correctly realized that these
are system wide, but you want a local mutex just for the logger process. You need
also some basic communication between the "run stop thread" and the "logger main
thread". Maybe Pierre remembers that once there was the problem that the logger did
not know when all events "came down the pipe" and could close the file. He added
some delay which helped most of the time. But if we would have some communication
from the "run stop thread" telling the main thread that all programs except the
logger have stopped the run, then the logger only has to empty the local system
buffer and knows 100% that everything is done.

In the MEG experiment we have the same problem. We need a certain sequence
(basically because we have 9 front-ends and one event builder, which has to be
called after the front-ends). We realized quickly that the logger cannot stop the
run, so we wrote a little tool "RunSubmit", which is a run sequence with scripting
facility. So you write a XML file, telling RunSubmit to start 10 runs, each with
5000 events. RunSubmit now watches the run statistics and stops the run. Since it's
outside the logger process, there is no dead lock. Unfortunately RunSubmit was
written by one of our students and contains some MEG specific code. Otherwise it
could be committed to the distribution.

So I feel that a separate thread for run stop (and maybe even start) would be a
good thing, but I'm not sure when I will have time to address this issue.

- Stefan |
|
18 Oct 2008, Konstantin Olchanski, Info, make linux32 & co
|
The Makefile targets for crosscompiling MIDAS are now documented in the MIDAS
Doxygen documentation:

make linux32 & make clean32
make linux64 & make clean64
make crosscompile
make dox

This has to do with which flavour of MIDAS is built by default: 32-bit or 64-bit.

This is how this works now.

Default flavour is determined by ROOT. If ROOTSYS points to 32-bit ROOT, then
32-bit MIDAS is built, if 64-bit ROOT, then 64-bit MIDAS. This works well after
the ROOT team added the correct "-m32" and "-m64" flags to "rootconfig --cflags".

If for some reason, we also need a non-default flavour of MIDAS, for example
when the main daq computer runs 64-bit MIDAS, but one frontend has to run on a
"32-bit only" VME processor, you say "make linux32". This creates the
"linux-m32/{lib,bin}" tree that you then reference in the Makefile of your
special frontend (i.e. instead of "-L$MIDASSYS/linux/lib" say
"-L$MIDASSYS/linux-m32/lib"). "make linux64" works the same way.

These non-default flavours of MIDAS are compiled with most special features
disabled: no ROOT, no MYSQL, etc.

When building "make linux32", you may also see errors caused by missing 32-bit
libraries - many 64-bit Linux distributions do not install the full 32-bit
development environment by default - so some header files and libraries may be
reported as missing. These not-installed-by-default 32-bit packages are usually
easy to install using commands like "yum install libxxx-devel.i386".

K.O. |
|