| ID |
Date |
Author |
Topic |
Subject |
|
773
|
05 Jul 2011 |
Konstantin Olchanski | Info | midas shared memory changes | > 2) the shared memory type used by an experiment is recorded in the file .SHM_TYPE.TXT.
An error with creating the file .SHM_TYPE.TXT was corrected in system.c svn rev 5125 - if file did not exist, it is
created correctly, but MIDAS reports "cannot connect to ODB". Second try works correctly because the file exists
now.
> 3) the hostname of the computer where the ODB shared memory is meant to reside is now
> recorded in the file .SHM_HOST.TXT.
This is causing problems on mobile computers where "hostname" changes all the time (i.e. set according to
DHCP on whatever network happens to be connected).
If you run into this problem, keep deleting .SHM_HOST.TXT or use this workaround: disable the hostname check
by making the file .SHM_HOST.TXT empty (zero length).
K.O. |
|
777
|
11 Jul 2011 |
Konstantin Olchanski | Info | Make "STOP" run transition always succeed | Over the years, there was some back-and-forth changes in what happens to run transitions when some
of the participants misbehave (do not respond to RPC calls, timeout, crash, etc).
The very original behaviour was to ignore all errors. This resulted in user confusion when some clients
would start, some would not, data from frontends that missed the transition did not arrive, etc.
So it was changed to fail the transition if any client misbehaves.
This left mlogger (who is usually the first one to see the TR_START transition) in a funny state - output
file is open, etc, but there is no run active. This was fixed by adding a TR_STARTABORT transition to tell
mlogger, event builder & co that the just started run did not start after all.
Also at some point code was added to forcefully kill clients that do not respond to run transitions (do
not respond to RPC, timeout, etc).
Recently, it was observed how during unattended overnight operation of a MIDAS DAQ system, with the
logger set to "auto restart", some unnecessary clients misbehave during the run stop transition, and
prevent the run from stopping and restarting. The user comes in the morning and is unhappy that data
taking stopped some time during the night.
midas.c svn rev 5136 changes the TR_STOP transition to always succeed, even if some clients had
transition errors. If these clients are unnecessary for normal operation of the DAQ, the following run
"auto restart" will continue taking data. If those were important clients, data taking will continue the
best it can - it *is* unattended operation - nobody is looking - but users can always setup alarms for
checking that important clients are always running during data taking. (For very important clients, one
can setup alarms to send email, send SMS messages, etc).
K.O. |
|
783
|
30 Jan 2012 |
Stefan Ritt | Info | IEEE Real Time 2012 Call for Abstracts | Hello,
I'm co-organizing the upcoming Real Time Conference, which covers also the field of data acquisition, so it might be interesting for people working
with MIDAS. If you have something to report, you could also consider to send an abstract to this conference. It will be nicely located in Berkeley,
California. We plan excursions to San Francisco and to Napa Valley.
Best regards,
Stefan Ritt
---------------------------
18th Real Time Conference
June 11 � 15, 2012
Berkeley, CA
We invite you to the Hotel Shattuck Plaza in downtown Berkeley, California for
the 2012 Real-Time Conference (RT2012). It will take place Monday, June 11
through Friday, June 15, 2012, with optional pre-conference tutorials Saturday
and Sunday, June 9-10.
Like the previous editions, RT2012 will be a multidisciplinary conference
devoted to the latest developments on realtime techniques in the fields of
plasma and nuclear fusion, particle physics, nuclear physics and astrophysics,
space science, accelerators, medical physics, nuclear power instrumentation and
other radiation instrumentation.
Abstract submission is open as of 18 January (deadline 2 March). Please visit
http://www.npss-confs.org/rtc/welcome.asp?flag=44675.77&Retry=1 to submit an
abstract.
Call for Abstracts
RT 2012 is an interdisciplinary conference on realtime data acquisition and
computing applications in the physical sciences. These applications include:
* High energy physics
* Nuclear physics
* Astrophysics and astroparticle physics
* Nuclear fusion
* Medical physics
* Space instrumentation
* Nuclear power instrumentation
* Realtime security and safety
* General Radiation Instrumentation
Specific topics include (but are certainly not limited to) the list shown below.
We welcome correspondence to see how your research fits our venue.
Key Dates
* Abstract submission opened: January 18, 2012
* Abstract deadline: March 2, 2012
* Program available: April 2
Suggested Topics
* Realtime system architectures
* Intelligent signal processing
* Programmable devices
* Fast data transfer links and networks
* Trigger systems
* Data acquisition
* Processing farms
* Control, monitoring, and test systems
* Upgrades
* Emerging realtime technologies
* New standards
* Realtime safety and security
* Feedback on experiences
Contact Information
If you have a question or wish to opt in for occasional e-mail updates about
RT2012, send us a message at RT2012@lbl.gov. To view full conference
information, visit http://rt2012.lbl.gov/index.html |
|
804
|
20 Jun 2012 |
Konstantin Olchanski | Info | lazylogger write to HADOOP HDFS | I tried using the lazylogger "Disk" method to write into a HADOOP HDFS clustered filesystem and found a
number of problems. I ended up replacing the lazylogger lazy_copy() function that still uses former YBOS
code with a new lazy_disk_copy() function that uses generic fread/fwrite. Also fixed the situation where
lazylogger cannot cleanly stop from the mhttpd "programs/stop" button while it is busy writing (the fix
works only for the "Disk" method).
(Note that one can also use the "Script" method for writing into HDFS)
Anyhow, the new lazylogger writes into HDFS just fine and I expect that it would also work for writing into
DCACHE using PNFS (if ever we get the SL6 PNFS working with our DCACHE servers).
Writing into our test HDFS cluster runs at about 20 MiBytes/sec for 1GB files with replication set to 3.
svn rev 5295
K.O. |
|
805
|
20 Jun 2012 |
Konstantin Olchanski | Info | midas vme benchmarks | I am recording here the results from a test VME system using two VF48 waveform digitizers and a 64-bit
dual-core VME processor (V7865). VF48 data suppression is off, VF48 modules set to read 48 channels,
1000 ADC samples each. mlogger data compression is enabled (gzip -1).
Event rate is about 200/sec
VME Data rate is about 40 Mbytes/sec
System is 100% busy (estimate)
System utilization of host computer (dual-core 2.2GHz, dual-channel DDR333 RAM):
(note high CPU use by mlogger for gzip compression of midas files)
top - 12:23:45 up 68 days, 20:28, 3 users, load average: 1.39, 1.22, 1.04
Tasks: 193 total, 3 running, 190 sleeping, 0 stopped, 0 zombie
Cpu(s): 32.1%us, 6.2%sy, 0.0%ni, 54.4%id, 2.7%wa, 0.1%hi, 4.5%si, 0.0%st
Mem: 3925556k total, 3797440k used, 128116k free, 1780k buffers
Swap: 32766900k total, 8k used, 32766892k free, 2970224k cached
PID USER PR NI VIRT RES SHR S %CPU %MEM TIME+ COMMAND
5169 trinat 20 0 246m 108m 97m R 64.3 2.8 29:36.86 mlogger
5771 trinat 20 0 119m 98m 97m R 14.9 2.6 139:34.03 mserver
6083 root 20 0 0 0 0 S 2.0 0.0 0:35.85 flush-9:3
1097 root 20 0 0 0 0 S 0.9 0.0 86:06.38 md3_raid1
System utilization of VME processor (dual-core 2.16 GHz, single-channel DDR2 RAM):
(note the more than 100% CPU use of multithreaded fevme)
top - 12:24:49 up 70 days, 19:14, 2 users, load average: 1.19, 1.05, 1.01
Tasks: 103 total, 1 running, 101 sleeping, 1 stopped, 0 zombie
Cpu(s): 6.3%us, 45.1%sy, 0.0%ni, 47.7%id, 0.0%wa, 0.2%hi, 0.6%si, 0.0%st
Mem: 1019436k total, 866672k used, 152764k free, 3576k buffers
Swap: 0k total, 0k used, 0k free, 20976k cached
PID USER PR NI VIRT RES SHR S %CPU %MEM TIME+ COMMAND
19740 trinat 20 0 177m 108m 984 S 104.5 10.9 1229:00 fevme_gef.exe
1172 ganglia 20 0 416m 99m 1652 S 0.7 10.0 1101:59 gmond
32353 olchansk 20 0 19240 1416 1096 R 0.2 0.1 0:00.05 top
146 root 15 -5 0 0 0 S 0.1 0.0 42:52.98 kslowd001
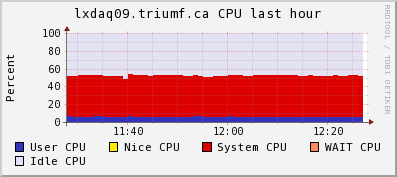
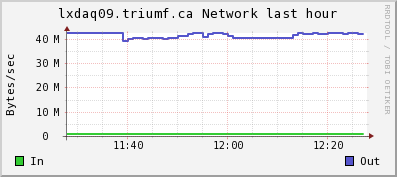
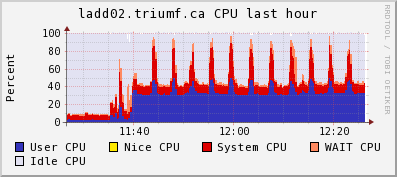
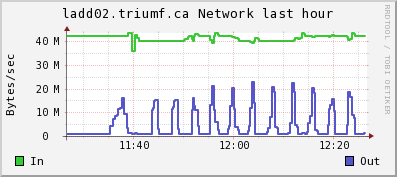
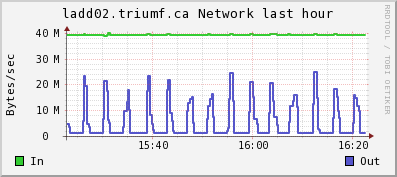
Attached are the CPU and network ganglia plots from lxdaq09 (VME) and ladd02 (host).
The regular bursts of "network out" on ladd02 is lazylogger writing mid.gz files to HADOOP HDFS.
K.O. |
| Attachment 1: lxdaq09cpu.gif
|
|
| Attachment 2: lxdaq09net.gif
|
|
| Attachment 3: ladd02cpu.gif
|
|
| Attachment 4: ladd02net.gif
|
|
|
806
|
20 Jun 2012 |
Konstantin Olchanski | Info | midas vme benchmarks | > I am recording here the results from a test VME system using two VF48 waveform digitizers
Note 1: data compression is about 89% (hence "data to disk" rate is much smaller than the "data from VME" rate)
Note 2: switch from VME MBLT64 block transfer to 2eVME block transfer:
- raises the VME data rate from 40 to 48 M/s
- event rate from 220/sec to 260/sec
- mlogger CPU use from 64% to about 80%
This is consistent with the measured VME block transfer rates for the VF48 module: MBLT64 is about 40 M/s, 2eVME is about 50 M/s (could be
80 M/s if no clock cycles were lost to sync VME signals with the VF48 clocks), 2eSST is implemented but impossible - VF48 cannot drive the
VME BERR and RETRY signals. Evil standards, grumble, grumble, grumble).
K.O. |
|
807
|
21 Jun 2012 |
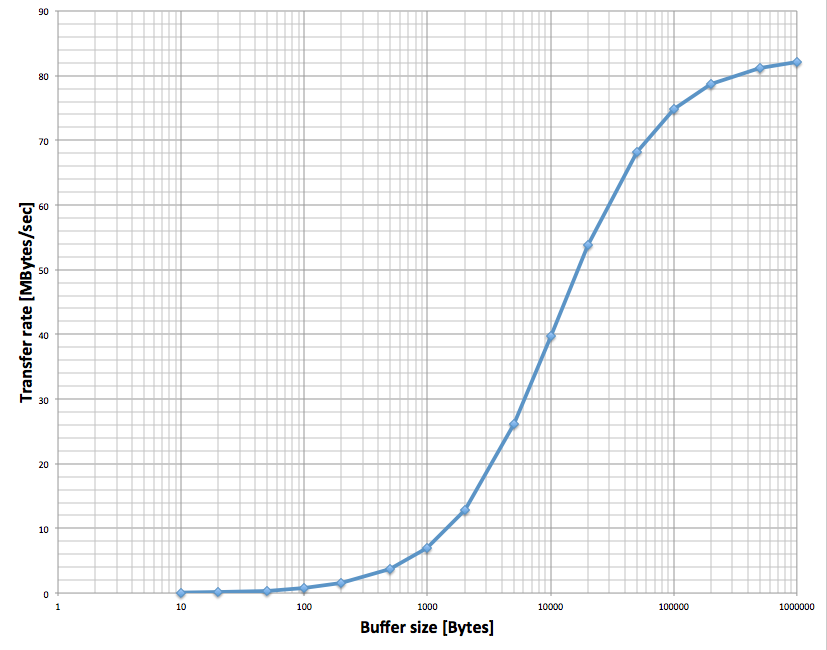
Stefan Ritt | Info | midas vme benchmarks | Just for completeness: Attached is the VME transfer speed I get with the SIS3100/SIS1100 interface using
2eVME transfer. This curve can be explained exactly with an overhead of 125 us per DMA transfer and a
continuous link speed of 83 MB/sec. |
| Attachment 1: Screen_Shot_2012-06-21_at_10.14.09_.png
|
|
|
809
|
21 Jun 2012 |
Konstantin Olchanski | Info | midas vme benchmarks | > Just for completeness: Attached is the VME transfer speed I get with the SIS3100/SIS1100 interface using
> 2eVME transfer. This curve can be explained exactly with an overhead of 125 us per DMA transfer and a
> continuous link speed of 83 MB/sec.
What VME module is on the other end?
K.O. |
|
810
|
22 Jun 2012 |
Stefan Ritt | Info | midas vme benchmarks | > > Just for completeness: Attached is the VME transfer speed I get with the SIS3100/SIS1100 interface using
> > 2eVME transfer. This curve can be explained exactly with an overhead of 125 us per DMA transfer and a
> > continuous link speed of 83 MB/sec.
>
> What VME module is on the other end?
>
> K.O.
The PSI-built DRS4 board, where we implemented the 2eVME protocol in the Virtex II FPGA. The same speed can be obtained with the commercial
VME memory module CI-VME64 from Chrislin Industries (see http://www.controlled.com/vme/chinp1.html).
Stefan |
|
811
|
22 Jun 2012 |
Zisis Papandreou | Info | adding 2nd ADC and TDC to crate | Hi folks:
we've been running midas-1.9.5 for a few years here at Regina. We are now
working on a larger cosmic ray testing that requires a second ADC and second TDC
module in our Camac crate (we use the hytek1331 controller by the way). We're
baffled as to how to set this up properly. Specifically we have tried:
frontend.c
/* number of channels */
#define N_ADC 12
(changed this from the old '8' to '12', and it seems to work for Lecroy 2249)
#define SLOT_ADC0 10
#define SLOT_TDC0 9
#define SLOT_ADC1 15
#define SLOT_TDC1 14
Is this the way to define the additional slots (by adding 0, 1 indices)?
Also, we were not able to get a new bank (ADC1) working, so we used a loop to
tag the second ADC values onto those of the first.
If someone has an example of how to handle multiple ADCs and TDCs and
suggestions as to where changes need to be made (header files, analyser, etc)
this would be great.
Thanks, Zisis...
P.S. I am attaching the relevant files. |
| Attachment 1: frontend.c
|
/********************************************************************\

  Name:         frontend.c
  Created by:   Stefan Ritt

  Contents:     Experiment specific readout code (user part) of
                Midas frontend. This example simulates a "trigger
                event" and a "scaler event" which are filled with
                CAMAC or random data. The trigger event is filled
                with two banks (ADC0 and TDC0), the scaler event
                with one bank (SCLR).

  $Log: frontend.c,v $
  Revision 1.14  2002/05/16 21:09:53  midas
  Added max_event_size_frag

  Revision 1.11  2000/08/21 10:32:51  midas
  Added max_event_size, set event_buffer_size = 10*max_event_size

  Revision 1.10  2000/03/13 18:53:29  pierre
  - Added 2nd arg in readout functions (offset for Super event)

  Revision 1.9  2000/03/02 22:00:00  midas
  Added number of subevents as zero

  Revision 1.8  1999/02/24 16:27:01  midas
  Added some "real" readout code

  Revision 1.7  1999/01/20 09:03:38  midas
  Added LAM_SOURCE_CRATE and LAM_SOURCE_STATION macros

  Revision 1.6  1999/01/19 10:27:30  midas
  Use new LAM_SOURCE and LAM_STATION macros

  Revision 1.5  1998/11/09 09:14:41  midas
  Added code to simulate random data

  Revision 1.4  1998/10/29 14:27:46  midas
  Added note about FE_ERR_HW in frontend_init()

  Revision 1.3  1998/10/28 15:50:58  midas
  Changed lam to DWORD

  Revision 1.2  1998/10/12 12:18:58  midas
  Added Log tag in header


\********************************************************************/

#include <stdio.h>
#include <stdlib.h>
#include "midas.h"
#include "mcstd.h"
#include "experim.h"

/* make frontend functions callable from the C framework */
#ifdef __cplusplus
extern "C" {frontend.c
#endif

/*-- Globals -------------------------------------------------------*/

/* The frontend name (client name) as seen by other MIDAS clients   */
char *frontend_name = "Sample Frontend";
/* The frontend file name, don't change it */
char *frontend_file_name = __FILE__;

/* frontend_loop is called periodically if this variable is TRUE    */
BOOL frontend_call_loop = FALSE;

/* a frontend status page is displayed with this frequency in ms */
INT display_period = 3000;

/* maximum event size produced by this frontend */
INT max_event_size = 10000;

/* maximum event size for fragmented events (EQ_FRAGMENTED) */
INT max_event_size_frag = 5*1024*1024;

/* buffer size to hold events */
INT event_buffer_size = 10*10000;

/* number of channels */
#define N_ADC  12
#define N_TDC  8
#define N_SCLR 8

/* CAMAC crate and slots */
#define CRATE      0
#define SLOT_IO   23
#define SLOT_ADC0   10
#define SLOT_TDC0   9
#define SLOT_ADC1   15
#define SLOT_TDC1   14
#define SLOT_SCLR  12

/*-- Function declarations -----------------------------------------*/

INT frontend_init();
INT frontend_exit();
INT begin_of_run(INT run_number, char *error);
INT end_of_run(INT run_number, char *error);
INT pause_run(INT run_number, char *error);
INT resume_run(INT run_number, char *error);
INT frontend_loop();

INT read_trigger_event(char *pevent, INT off);
INT read_scaler_event(char *pevent, INT off);

/*-- Equipment list ------------------------------------------------*/

#undef USE_INT

EQUIPMENT equipment[] = {

  { "Trigger",            /* equipment name */
    1, 0,                 /* event ID, trigger mask */
    "SYSTEM",             /* event buffer */
#ifdef USE_INT
    EQ_INTERRUPT,         /* equipment type */
#else
    EQ_POLLED,            /* equipment type */
#endif
    LAM_SOURCE(CRATE,LAM_STATION(SLOT_TDC0)), /* event source crate 0, TDC */
    "MIDAS",              /* format */
    TRUE,                 /* enabled */
    RO_RUNNING |          /* read only when running */
    RO_ODB,               /* and update ODB */
    500,                  /* poll for 500ms */
    0,                    /* stop run after this event limit */
    0,                    /* number of sub events */
    0,                    /* don't log history */
    "", "", "",
    read_trigger_event,   /* readout routine */
  },

  { "Scaler",             /* equipment name */
    2, 0,                 /* event ID, trigger mask */
    "SYSTEM",             /* event buffer */
    EQ_PERIODIC |
    EQ_MANUAL_TRIG,       /* equipment type */
    0,                    /* event source */
    "MIDAS",              /* format */
    TRUE,                 /* enabled */
    RO_RUNNING |
    RO_TRANSITIONS |      /* read when running and on transitions */
    RO_ODB,               /* and update ODB */
    10000,                /* read every 10 sec */
    0,                    /* stop run after this event limit */
    0,                    /* number of sub events */
    0,                    /* log history */
    "", "", "",
    read_scaler_event,    /* readout routine */
  },

  { "" }
};

#ifdef __cplusplus
}
#endif

/********************************************************************\
              Callback routines for system transitions

  These routines are called whenever a system transition like start/
  stop of a run occurs. The routines are called on the following
  occations:

  frontend_init:  When the frontend program is started. This routine
                  should initialize the hardware.

  frontend_exit:  When the frontend program is shut down. Can be used
                  to releas any locked resources like memory, commu-
                  nications ports etc.

  begin_of_run:   When a new run is started. Clear scalers, open
                  rungates, etc.

  end_of_run:     Called on a request to stop a run. Can send
                  end-of-run event and close run gates.

  pause_run:      When a run is paused. Should disable trigger events.

  resume_run:     When a run is resumed. Should enable trigger events.

\********************************************************************/

/*-- Frontend Init -------------------------------------------------*/

INT frontend_init()
{
  /* hardware initialization */

  cam_init();
  cam_crate_clear(CRATE);
  cam_crate_zinit(CRATE);
  cam_inhibit_set(CRATE);

  /* enable LAM in IO unit */
  /* camc(CRATE, SLOT_IO, 0, 26); */

  /* enable LAM in crate controller */
  /* cam_lam_enable(CRATE, SLOT_IO); */

  /* reset external LAM Flip-Flop */
  /* camo(CRATE, SLOT_IO, 1, 16, 0xFF); */
  /* camo(CRATE, SLOT_IO, 1, 16, 0); */

  /* print message and return FE_ERR_HW if frontend should not be started */

  return SUCCESS;
}

/*-- Frontend Exit -------------------------------------------------*/

INT frontend_exit()
{
  return SUCCESS;
}

/*-- Begin of Run --------------------------------------------------*/

INT begin_of_run(INT run_number, char *error)
{
  /* put here clear scalers etc. */


  /* clear TDC units */
  camc(CRATE, SLOT_TDC0, 0, 9);
  camc(CRATE, SLOT_TDC1, 0, 9);
  /* clear ADC units */
  camc(CRATE, SLOT_ADC0, 0, 9);
  camc(CRATE, SLOT_ADC1, 0, 9);

  /* disable LAM in ADC and TDC1 units */
  camc(CRATE, SLOT_ADC0, 0, 24);
  camc(CRATE, SLOT_ADC1, 0, 24);
  camc(CRATE, SLOT_TDC1, 0, 24);
  /* enable LAM in TDC0 unit */
  camc(CRATE, SLOT_TDC0, 0, 26);
  cam_inhibit_clear(CRATE);
  cam_lam_enable(CRATE, SLOT_TDC0);

  return SUCCESS;
}

/*-- End of Run ----------------------------------------------------*/

INT end_of_run(INT run_number, char *error)
{
  camc(CRATE, SLOT_TDC0, 0, 24);
  camc(CRATE, SLOT_ADC0, 0, 24);
  camc(CRATE, SLOT_TDC1, 0, 24);
  camc(CRATE, SLOT_ADC1, 0, 24);
  cam_inhibit_set(CRATE);

  return SUCCESS;
}

/*-- Pause Run -----------------------------------------------------*/

INT pause_run(INT run_number, char *error)
{
  return SUCCESS;
}

/*-- Resuem Run ----------------------------------------------------*/

INT resume_run(INT run_number, char *error)
{
  return SUCCESS;
}

/*-- Frontend Loop -------------------------------------------------*/

INT frontend_loop()
{
  /* if frontend_call_loop is true, this routine gets called when
     the frontend is idle or once between every event */
  return SUCCESS;
}

/*------------------------------------------------------------------*/

/********************************************************************\

  Readout routines for different events

\********************************************************************/

/*-- Trigger event routines ----------------------------------------*/

INT poll_event(INT source, INT count, BOOL test)
/* Polling routine for events. Returns TRUE if event
   is available. If test equals TRUE, don't return. The test
   flag is used to time the polling */
{
int   i;
DWORD lam;
... 155 more lines ...
|
| Attachment 2: analyzer.c
|
/********************************************************************\

  Name:         analyzer.c
  Created by:   Stefan Ritt

  Contents:     System part of Analyzer code for sample experiment

  $Log: analyzer.c,v $
  Revision 1.4  2000/03/02 22:00:18  midas
  Changed events sent to double

  Revision 1.3  1998/10/29 14:18:19  midas
  Used hDB consistently

  Revision 1.2  1998/10/12 12:18:58  midas
  Added Log tag in header


\********************************************************************/

/* standard includes */
#include <stdio.h>
#include <time.h>

/* midas includes */
#include "midas.h"
#include "experim.h"
#include "analyzer.h"

/* cernlib includes */
#ifdef OS_WINNT
#define VISUAL_CPLUSPLUS
#endif
#ifdef __linux__
#define f2cFortran
#endif
#ifndef MANA_LITE
#include <cfortran.h>
#include <hbook.h>

PAWC_DEFINE(1000000);
#endif
/*-- Globals -------------------------------------------------------*/

/* The analyzer name (client name) as seen by other MIDAS clients   */
char *analyzer_name = "Analyzer";

/* analyzer_loop is called with this interval in ms (0 to disable)  */
INT  analyzer_loop_period = 0;

/* default ODB size */
INT  odb_size = DEFAULT_ODB_SIZE;

/* ODB structures */

RUNINFO          runinfo;
GLOBAL_PARAM     global_param;
EXP_PARAM        exp_param;
TRIGGER_SETTINGS trigger_settings;

/*-- Module declarations -------------------------------------------*/

extern ANA_MODULE scaler_accum_module;
extern ANA_MODULE adc_calib_module;
extern ANA_MODULE adc_summing_module;

ANA_MODULE *scaler_module[] = {
  &scaler_accum_module,
  NULL
};

ANA_MODULE *trigger_module[] = {
  &adc_calib_module,
  &adc_summing_module,
  NULL
};

/*-- Bank definitions ----------------------------------------------*/

ASUM_BANK_STR(asum_bank_str);

BANK_LIST trigger_bank_list[] = {
  /* online banks */
  { "ADC0", TID_WORD, 2*N_ADC, NULL },
/*  { "ADC1", TID_WORD, N_ADC, NULL },
  { "TDC1", TID_WORD, N_TDC, NULL }, */
  { "TDC0", TID_WORD, 2*N_TDC, NULL },

  /* calculated banks */
  { "CADC", TID_FLOAT, N_ADC, NULL },
  { "ASUM", TID_STRUCT, sizeof(ASUM_BANK), asum_bank_str },

  { "" },
};

BANK_LIST scaler_bank_list[] = {
  /* online banks */
  { "SCLR", TID_DWORD,  N_ADC, NULL },

  /* calculated banks */
  { "ACUM", TID_DOUBLE, N_ADC, NULL },
  { "" },
};

/*-- Event request list --------------------------------------------*/

ANALYZE_REQUEST analyze_request[] = {
  { "Trigger",            /* equipment name */
    1,                    /* event ID */
    TRIGGER_ALL,          /* trigger mask */
    GET_SOME,             /* get some events */
    "SYSTEM",             /* event buffer */
    TRUE,                 /* enabled */
    "", "",
    NULL,                 /* analyzer routine */
    trigger_module,       /* module list */
    trigger_bank_list,    /* bank list */
    1000,                 /* RWNT buffer size */
    TRUE,                 /* Use tests for this event */
  },

  { "Scaler",             /* equipment name */
    2,                    /* event ID */
    TRIGGER_ALL,          /* trigger mask */
    GET_ALL,              /* get all events */
    "SYSTEM",             /* event buffer */
    TRUE,                 /* enabled */
    "", "",
    NULL,                 /* analyzer routine */
    scaler_module,        /* module list */
    scaler_bank_list,     /* bank list */
    100,                  /* RWNT buffer size */
  },

  { "" }
};

/*-- Analyzer Init -------------------------------------------------*/

INT analyzer_init()
{
HNDLE hDB, hKey;
char  str[80];

RUNINFO_STR(runinfo_str);
EXP_PARAM_STR(exp_param_str);
EXP_EDIT_STR(exp_edit_str);
GLOBAL_PARAM_STR(global_param_str);
TRIGGER_SETTINGS_STR(trigger_settings_str);

  /* open ODB structures */
  cm_get_experiment_database(&hDB, NULL);
  db_create_record(hDB, 0, "/Runinfo", strcomb(runinfo_str));
  db_find_key(hDB, 0, "/Runinfo", &hKey);
  if (db_open_record(hDB, hKey, &runinfo, sizeof(runinfo), MODE_READ, NULL, NULL) != DB_SUCCESS)
    {
    cm_msg(MERROR, "analyzer_init", "Cannot open \"/Runinfo\" tree in ODB");
    return 0;
    }

  db_create_record(hDB, 0, "/Experiment/Run Parameters", strcomb(exp_param_str));
  db_find_key(hDB, 0, "/Experiment/Run Parameters", &hKey);
  if (db_open_record(hDB, hKey, &exp_param, sizeof(exp_param), MODE_READ, NULL, NULL) != DB_SUCCESS)
    {
    cm_msg(MERROR, "analyzer_init", "Cannot open \"/Experiment/Run Parameters\" tree in ODB");
    return 0;
    }

  db_create_record(hDB, 0, "/Experiment/Edit on start", strcomb(exp_edit_str));

  sprintf(str, "/%s/Parameters/Global", analyzer_name);
  db_create_record(hDB, 0, str, strcomb(global_param_str));
  db_find_key(hDB, 0, str, &hKey);
  if (db_open_record(hDB, hKey, &global_param, sizeof(global_param), MODE_READ, NULL, NULL) != DB_SUCCESS)
    {
    cm_msg(MERROR, "analyzer_init", "Cannot open \"%s\" tree in ODB", str);
    return 0;
    }

  db_create_record(hDB, 0, "/Equipment/Trigger/Settings", strcomb(trigger_settings_str));
  db_find_key(hDB, 0, "/Equipment/Trigger/Settings", &hKey);

  if (db_open_record(hDB, hKey, &trigger_settings, sizeof(trigger_settings), MODE_READ, NULL, NULL) != DB_SUCCESS)
    {
    cm_msg(MERROR, "analyzer_init", "Cannot open \"/Equipment/Trigger/Settings\" tree in ODB");
    return 0;
    }

  return SUCCESS;
}

/*-- Analyzer Exit -------------------------------------------------*/

INT analyzer_exit()
{
  return CM_SUCCESS;
}

/*-- Begin of Run --------------------------------------------------*/

INT ana_begin_of_run(INT run_number, char *error)
{
  return CM_SUCCESS;
}

/*-- End of Run ----------------------------------------------------*/

INT ana_end_of_run(INT run_number, char *error)
{
FILE   *f;
time_t now;
char   str[256];
int    size;
double n;
HNDLE  hDB;
BOOL   flag;

  cm_get_experiment_database(&hDB, NULL);

  /* update run log if run was written and running online */

  size = sizeof(flag);
  db_get_value(hDB, 0, "/Logger/Write data", &flag, &size, TID_BOOL, TRUE);
  /* if (flag && runinfo.online_mode == 1) */
  if (flag )
    {
    /* update run log */
    size = sizeof(str);
    str[0] = 0;
    db_get_value(hDB, 0, "/Logger/Data Dir", str, &size, TID_STRING, TRUE);
    if (str[0] != 0)
      if (str[strlen(str)-1] != DIR_SEPARATOR)
        strcat(str, DIR_SEPARATOR_STR);
    strcat(str, "runlog.txt");

    f = fopen(str, "a");

    time(&now);
    strcpy(str, ctime(&now));
    str[10] = 0;

    fprintf(f, "%s\t%3d\t", str, runinfo.run_number);

    strcpy(str, runinfo.start_time);
    str[19] = 0;
    fprintf(f, "%s\t", str+11);

    strcpy(str, ctime(&now));
    str[19] = 0;
    fprintf(f, "%s\t", str+11);

    size = sizeof(n);
    db_get_value(hDB, 0, "/Equipment/Trigger/Statistics/Events sent", &n, &size, TID_DOUBLE, TRUE);

    fprintf(f, "%5.1lfk\t", n/1000);
    fprintf(f, "%s\n", exp_param.comment);

    fclose(f);
    }

  return CM_SUCCESS;
}

/*-- Pause Run -----------------------------------------------------*/

INT ana_pause_run(INT run_number, char *error)
{
  return CM_SUCCESS;
}

/*-- Resume Run ----------------------------------------------------*/

INT ana_resume_run(INT run_number, char *error)
{
  return CM_SUCCESS;
}

/*-- Analyzer Loop -------------------------------------------------*/

INT analyzer_loop()
{
  return CM_SUCCESS;
}

/*------------------------------------------------------------------*/
|
| Attachment 3: analyzer.h
|
/********************************************************************\

  Name:         analyzer.h
  Created by:   Stefan Ritt

  Contents:     Analyzer global include file

  $Log: analyzer.h,v $
  Revision 1.2  1998/10/12 12:18:58  midas
  Added Log tag in header


\********************************************************************/

/*-- Parameters ----------------------------------------------------*/

/* number of channels */
#define N_ADC              12
#define N_TDC               8
#define N_SCLR              8

/*-- Histo ID bases ------------------------------------------------*/

#define ADCCALIB_ID_BASE 2000
#define ADCSUM_ID_BASE   3000
|
|
812
|
24 Jun 2012 |
Konstantin Olchanski | Info | midas vme benchmarks | > > > Just for completeness: Attached is the VME transfer speed I get with the SIS3100/SIS1100 interface using
> > > 2eVME transfer. This curve can be explained exactly with an overhead of 125 us per DMA transfer and a
> > > continuous link speed of 83 MB/sec.
>
> [with ...] the PSI-built DRS4 board, where we implemented the 2eVME protocol in the Virtex II FPGA.
This is an interesting hardware benchmark. Do you also have benchmarks of the MIDAS system using the DRS4 (measurements
of end-to-end data rates, maximum event rate, maximum trigger rate, any tuning of the frontend program
and of the MIDAS experiment to achieve those rates, etc)?
K.O. |
|
813
|
24 Jun 2012 |
Konstantin Olchanski | Info | midas vme benchmarks | > > I am recording here the results from a test VME system using two VF48 waveform digitizers
(I now have 4 VF48 waveform digitizers, so the event rates are half of those reported before. Date rate
is up to 51 M/s - event size has doubled, per-event overhead is the same, so the effective data rate goes
up).
This message demonstrates the effects of tuning the MIDAS system for high rate data taking.
Attached is the history plot of the event rate counters which show the real-time performance of the MIDAS
system with better detail compared to the average event rate reported on the MIDAS status page. For an
ideal real-time system, the event rate should be a constant, without any drop-outs.
Seen on the plot:
run 75: the periodic dropouts in the event rate correspond to the lazylogger writing data into HADOOP
HDFS. Clearly the host computer cannot keep up with both data taking and data archiving at the same
time. (see the output of "top" "with HDFS" and "without HDFS" below)
run 76: SYSTEM buffer size increased from 100Mbytes to 300Mbytes. Maybe there is an improvement.
run 77-78: "event_buffer_size" inside the multithreaded (EQ_MULTITHREAD) VME frontend increased from
100Mbytes to 300Mbytes. (6 seconds of data at 50M/s). Much better, yes?
Conclusion: for improved real-time performance, there should be sufficient buffering between the VME
frontend readout thread and the mlogger data compression thread.
For benchmark hardware, at 50M/s, 4 seconds of buffer space (100M in the SYSTEM buffer and 100M in
the frontend) is not enough. 12 seconds of buffer space (300+300) is much better. (Or buy a faster
backend computer).
P.S. HDFS data rate as measured by lazylogger is around 20M/s for CDH3 HADOOP and around 30M/s for
CDH4 HADOOP.
P.S. Observe the ever present unexplained event rate fluctuations between 130-140 event/sec.
K.O.
---- "top" output during normal data taking, notice mlogger data compression consumes 99% CPU at 51
M/s data rate.
top - 08:55:22 up 72 days, 17:00, 5 users, load average: 2.47, 2.32, 2.27
Tasks: 206 total, 2 running, 204 sleeping, 0 stopped, 0 zombie
Cpu(s): 52.2%us, 6.1%sy, 0.0%ni, 34.4%id, 0.8%wa, 0.1%hi, 6.2%si, 0.0%st
Mem: 3925556k total, 3064928k used, 860628k free, 3788k buffers
Swap: 32766900k total, 200704k used, 32566196k free, 2061048k cached
PID USER PR NI VIRT RES SHR S %CPU %MEM TIME+ COMMAND
5826 trinat 20 0 437m 291m 287m R 97.6 7.6 636:39.63 mlogger
27617 trinat 20 0 310m 288m 288m S 24.6 7.5 6:59.28 mserver
1806 ganglia 20 0 415m 62m 1488 S 0.9 1.6 668:43.55 gmond
--- "top" output during lazylogger/HDFS activity. Observe high CPU use by lazylogger and fuse_dfs (the
HADOOP HDFS client). Observe that CPU use adds up to 167% out of 200% available.
top - 08:57:16 up 72 days, 17:01, 5 users, load average: 2.65, 2.35, 2.29
Tasks: 206 total, 2 running, 204 sleeping, 0 stopped, 0 zombie
Cpu(s): 57.6%us, 23.1%sy, 0.0%ni, 8.1%id, 0.0%wa, 0.4%hi, 10.7%si, 0.0%st
Mem: 3925556k total, 3642136k used, 283420k free, 4316k buffers
Swap: 32766900k total, 200692k used, 32566208k free, 2597752k cached
PID USER PR NI VIRT RES SHR S %CPU %MEM TIME+ COMMAND
5826 trinat 20 0 437m 291m 287m R 68.7 7.6 638:24.07 mlogger
23450 root 20 0 1849m 200m 4472 S 64.4 5.2 75:35.64 fuse_dfs
27617 trinat 20 0 310m 288m 288m S 18.5 7.5 7:22.06 mserver
26723 trinat 20 0 38720 11m 1172 S 17.9 0.3 22:37.38 lazylogger
7268 trinat 20 0 1007m 35m 4004 D 1.3 0.9 187:14.52 nautilus
1097 root 20 0 0 0 0 S 0.8 0.0 101:45.55 md3_raid1 |
| Attachment 1: Scalers_(1).gif
|
.gif.png)
|
|
814
|
25 Jun 2012 |
Stefan Ritt | Info | midas vme benchmarks | > P.S. Observe the ever present unexplained event rate fluctuations between 130-140 event/sec.
An important aspect of optimizing your system is to keep the network traffic under control. I use GBit Ethernet between FE and BE, and make sure the switch
can accomodate all accumulated network traffic through its backplane. This way I do not have any TCP retransmits which kill you. Like if a single low-level
ethernet packet is lost due to collision, the TCP stack retransmits it. Depending on the local settings, this can be after a timeout of one (!) second, which
punches already a hole in your data rate. On the MSCB system actually I use UDP packets, where I schedule the retransmit myself. For a LAN, 10-100ms timeout
is there enough. The one second is optimized for a WAN (like between two continents) where this is fine, but it is not what you want on a LAN system. Also
make sure that the outgoing traffic (lazylogger) uses a different network card than the incoming traffic. I found that this also helps a lot.
- Stefan |
|
815
|
25 Jun 2012 |
Konstantin Olchanski | Info | midas vme benchmarks | > > P.S. Observe the ever present unexplained event rate fluctuations between 130-140 event/sec.
>
> An important aspect of optimizing your system is to keep the network traffic under control. I use GBit Ethernet between FE and BE, and make sure the switch
> can accomodate all accumulated network traffic through its backplane. This way I do not have any TCP retransmits which kill you. Like if a single low-level
> ethernet packet is lost due to collision, the TCP stack retransmits it. Depending on the local settings, this can be after a timeout of one (!) second, which
> punches already a hole in your data rate. On the MSCB system actually I use UDP packets, where I schedule the retransmit myself. For a LAN, 10-100ms timeout
> is there enough. The one second is optimized for a WAN (like between two continents) where this is fine, but it is not what you want on a LAN system. Also
> make sure that the outgoing traffic (lazylogger) uses a different network card than the incoming traffic. I found that this also helps a lot.
>
In typical applications at TRIUMF we do not setup a private network for the data traffic - data from VME to backend computer
and data from backend computer to DCACHE all go through the TRIUMF network.
This is justified by the required data rates - the highest data rate experiment running right now is PIENU - running
at about 10 M/s sustained, nominally April through December. (This is 20% of the data rate of the present benchmark).
The next highest data rate experiment is T2K/ND280 in Japan running at about 20 M/s (neutrino beam, data rate
is dominated by calibration events).
All other experiments at TRIUMF run at lower data rates (low intensity light ion beams), but we are planning for an experiment
that will run at 300 M/s sustained over 1 week of scheduled beam time.
But we do have the technical capability to separate data traffic from the TRIUMF network - the VME processors and
the backend computers all have dual GigE NICs.
(I did not say so, but obviously the present benchmark at 50 M/s VME to backend and 20-30 M/s from backend to HDFS is a GigE network).
(I am not monitoring the TCP loss and retransmit rates at present time)
(The network switch between VME and backend is a "the cheapest available" rackmountable 8-port GigE switch. The network between
the backend and the HDFS nodes is mostly Nortel 48-port GigE edge switches with single-GigE uplinks to the core router).
K.O. |
|
816
|
26 Jun 2012 |
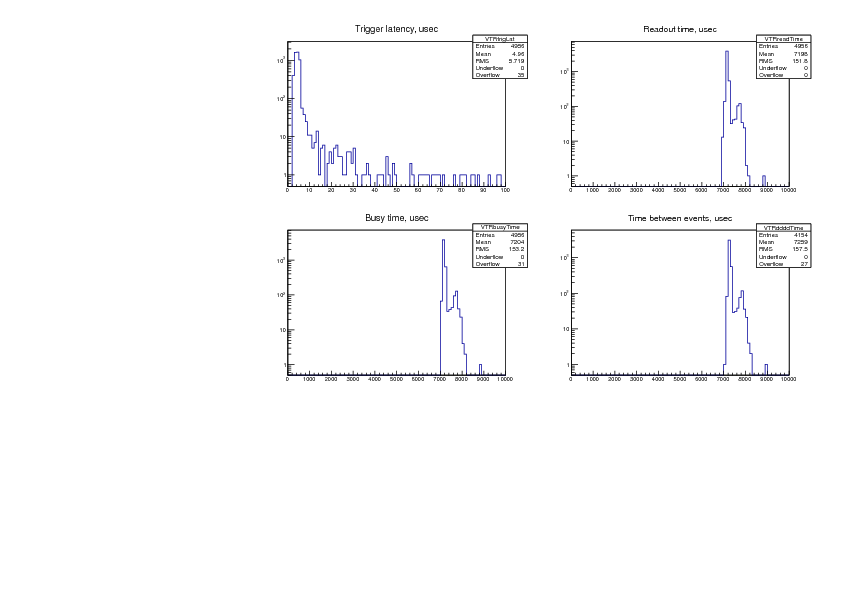
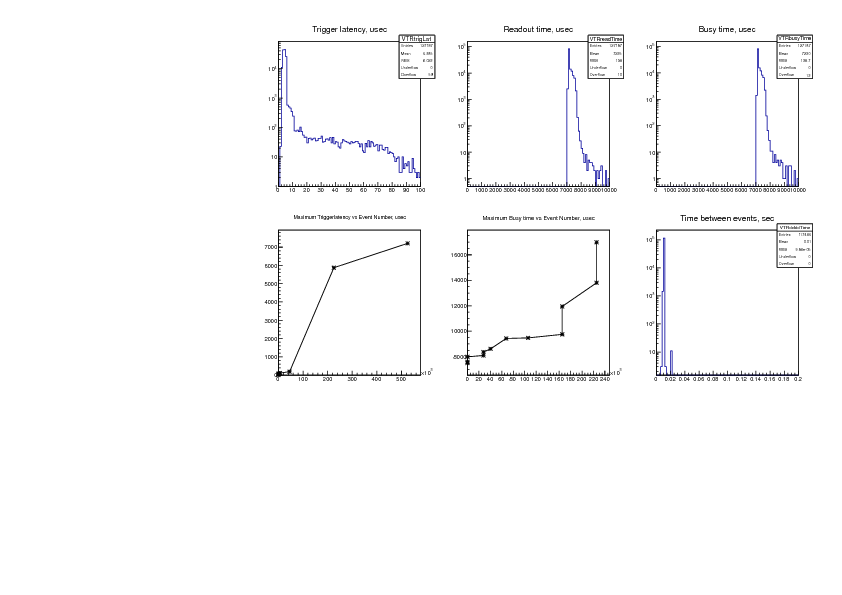
Konstantin Olchanski | Info | midas vme benchmarks | > > > I am recording here the results from a test VME system using four VF48 waveform digitizers
Now we look at the detail of the event readout, or if you want, the real-time properties of the MIDAS
multithreaded VME frontend program.
The benchmark system includes a TRIUMF-made VME-NIMIO32 VME trigger module which records the
time of the trigger and provides a 20 MHz timestamp register. The frontend program is instrumented to
save the trigger time and readout timing data into a special "trigger" bank ("VTR0"). The ROOTANA-based
MIDAS analyzer is used to analyze this data and to make these plots.
Timing data is recorded like this:
NIM trigger signal ---> latched into the IO32 trigger time register (VTR0 "trigger time")
...
int read_event(pevent, etc) {
VTR0 "trigger time" = io32->latched_trigger_time();
VTR0 "readout start time" = io32->timestamp();
read the VF48 data
io32->release_busy();
VTR0 "readout end time" = io32->timestamp();
}
From the VTR0 time data, we compute these values:
1) "trigger latency" = "readout start time" - "trigger time" --- the time it takes us to "see" the trigger
2) "readout time" = "readout end time" - "readout start time" --- the time it takes to read the VF48 data
3) "busy time" = "readout end time" - "trigger time" --- time during which the "DAQ busy" trigger veto is
active.
also computed is
4) "time between events" = "trigger time" - "time of previous trigger"
And plot them on the attached graphs:
1) "trigger latency" - we see average trigger latency is 5 usec with hardly any events taking more than 10
usec (notice the log Y scale!). Also notice that there are 35 events that took longer that 100 usec (0.7% out
of 5000 events).
So how "real time" is this? For "hard real time" the trigger latency should never exceed some maximum,
which is determined by formal analysis or experimentally (in which case it will carry an experimental error
bar - "response time is always less than X usec with probability 99.9...%" - the better system will have
smaller X and more nines). Since I did not record the maximum latency, I can only claim that the
"response time is always less than 1 sec, I am pretty sure of it".
For "soft real time" systems, such as subatomic particle physics DAQ systems, one is permitted to exceed
that maximum response time, but "not too often". Such systems are characterized by the quantities
derived from the present plot (mean response time, frequency of exceeding some deadlines, etc). The
quality of a soft real time system is usually judged by non-DAQ criteria (i.e. if the DAQ for the T2K/ND280
experiment does not respond within 20 msec, a neutrino beam spill an be lost and the experiment is
required to report the number of lost spills to the weekly facility management meeting).
Can the trigger latency be improved by using interrupts instead of polling? Remember that on most
hardware, the VME and PCI bus access time is around 1 usec and trigger latency of 5-10 usec corresponds
to roughly 5-10 reads of a PCI or VME register. So there is not much room for speed up. Consider that an
interrupt handler has to perform at least 2-3 PCI register reads (to determine the source of the interrupt
and to clear the interrupt condition), it has to wake up the right process and do a rather slow CPU context
switch, maybe do a cross-CPU interrupt (if VME interrupts are routed to the wrong CPU core). All this
takes time. Then the Linux kernel interrupt latency comes into play. All this is overhead absent in pure-
polling implementations. (Yes, burning a CPU core to poll for data is wasteful, but is there any other use
for this CPU core? With a dual-core CPU, the 1st core polls for data, the 2nd core runs mfe.c, the TCP/IP
stack and the ethernet transmitter.)
2) "readout time" - between 7 and 8 msec, corresponding to the 50 Mbytes/sec VME block transfer rate.
No events taking more than 10 msec. (Could claim hard real time performance here).
3) "busy time" - for the simple benchmark system it is a boring sum of plots (1) and (2). The mean busy
time ("dead time") goes straight into the formula for computing cross-sections (if that is what you do).
4) "time between events" - provides an independent measurement of dead time - one can see that no
event takes less than 7 msec to process and 27 events took longer than 10 msec (0.65% out of 4154
events). If the trigger were cosmic rays instead of a pulser, this plot would also measure the cosmic ray
event rate - one would see the exponential shape of the Poisson distribution (linear on Log scale, with the
slope being the cosmic event rate).
K.O. |
| Attachment 1: canvas.pdf
|
|
|
817
|
26 Jun 2012 |
Konstantin Olchanski | Info | midas vme benchmarks | > > > > I am recording here the results from a test VME system using four VF48
waveform digitizers
Last message from this series. After all the tuning, I reduce the trigger rate
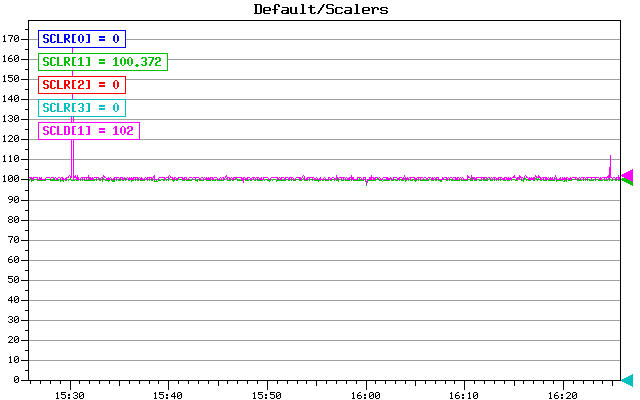
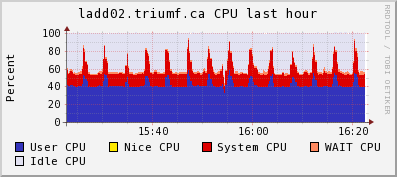
from 120 Hz to 100 Hz to see
what happens when the backend computer is not overloaded and has some spare
capacity.
event rate: 100 Hz (down from 120 Hz)
data rate: 37 Mbytes/sec (down from 50 M/s)
mlogger cpu use: 65% (down from 99%)
Attached:
1) trigger rate event plot: now the rate is solid 100 Hz without dropouts
2) CPU and Network plots frog ganglia: the spikes is lazylogger saving mid.gz
files to HDFS storage
3) time structure plots:
a) trigger latency: mean 5 us, most below 10 us, 59 events (0.046%) longer than
100 us, (bottom left graph) 7000 us is longest latency observed.
b) readout time is 7000-8000 us (same as before - VME data rate is independant
from the trigger rate)
c) busy time: mean 7.2 us, 12 events (0.0094%) longer than 10 ms, longest busy
time ever observed is 17 ms (bottom middle graph)
d) time between events is 10 ms (100 Hz pulser trigger), 1 event was missed
about 10 times (spike at 20 ms) (0.0085%), more than 1 event missed never (no
spike at 30 ms, 40 ms, etc).
CPU use on the backend computer:
top - 16:30:59 up 75 days, 35 min, 6 users, load average: 0.98, 0.99, 1.01
Tasks: 206 total, 3 running, 203 sleeping, 0 stopped, 0 zombie
Cpu(s): 39.3%us, 8.2%sy, 0.0%ni, 39.4%id, 5.7%wa, 0.3%hi, 7.2%si, 0.0%st
Mem: 3925556k total, 3404192k used, 521364k free, 8792k buffers
Swap: 32766900k total, 296304k used, 32470596k free, 2477268k cached
PID USER PR NI VIRT RES SHR S %CPU %MEM TIME+ COMMAND
5826 trinat 20 0 441m 292m 287m R 65.8 7.6 2215:16 mlogger
26756 trinat 20 0 310m 288m 288m S 16.8 7.5 34:32.03 mserver
29005 olchansk 20 0 206m 39m 17m R 14.7 1.0 26:19.42 ana_vf48.exe
7878 olchansk 20 0 99m 3988 740 S 7.7 0.1 27:06.34 sshd
29012 trinat 20 0 314m 288m 288m S 2.8 7.5 4:22.14 mserver
23317 root 20 0 0 0 0 S 1.4 0.0 24:21.52 flush-9:3
K.O. |
| Attachment 1: Scalers.gif
|
|
| Attachment 2: ladd02-cpu.png
|
|
| Attachment 3: ladd02-net.png
|
|
| Attachment 4: canvas-1000-100Hz.pdf
|
|
|
818
|
29 Jun 2012 |
Konstantin Olchanski | Info | lazylogger write to HADOOP HDFS | > Anyhow, the new lazylogger writes into HDFS just fine and I expect that it would also work for writing into
> DCACHE using PNFS (if ever we get the SL6 PNFS working with our DCACHE servers).
>
> Writing into our test HDFS cluster runs at about 20 MiBytes/sec for 1GB files with replication set to 3.
Minor update to lazylogger and mlogger:
lazylogger default timeout 60 sec is too short for writing into HDFS - changed to 10 min.
mlogger checks for free space were insufficient and it would fill the output disk to 100% full before stopping
the run. Now for disks bigger than 100GB, it will stop the run if there is less than 1GB of free space. (100%
disk full would break the history and the elog if they happen to be on the same disk).
Also I note that mlogger.cxx rev 5297 includes a fix for a performance bug introduced about 6 month ago (mlogger
would query free disk space after writing each event - depending on your filesystem configuration and the event
rate, this bug was observed to extremely severely reduce the midas disk writing performance).
svn rev 5296, 5297
K.O.
P.S. I use these lazylogger settings for writing to HDFS. Write speed varies around 10-20-30 Mbytes/sec (4-node
cluster, 3 replicas of each file).
[local:trinat_detfac:S]Settings>pwd
/Lazy/HDFS/Settings
[local:trinat_detfac:S]Settings>ls -l
Key name Type #Val Size Last Opn Mode Value
---------------------------------------------------------------------------
Period INT 1 4 7m 0 RWD 10
Maintain free space (%) INT 1 4 7m 0 RWD 20
Stay behind INT 1 4 7m 0 RWD 0
Alarm Class STRING 1 32 7m 0 RWD
Running condition STRING 1 128 7m 0 RWD ALWAYS
Data dir STRING 1 256 7m 0 RWD /home/trinat/online/data
Data format STRING 1 8 7m 0 RWD MIDAS
Filename format STRING 1 128 7m 0 RWD run*
Backup type STRING 1 8 7m 0 RWD Disk
Execute after rewind STRING 1 64 7m 0 RWD
Path STRING 1 128 7m 0 RWD /hdfs/users/trinat/data
Capacity (Bytes) FLOAT 1 4 7m 0 RWD 5e+09
List label STRING 1 128 7m 0 RWD HDFS
Execute before writing file STRING 1 64 7m 0 RWD
Execute after writing file STRING 1 64 7m 0 RWD
Modulo.Position STRING 1 8 7m 0 RWD
Tape Data Append BOOL 1 4 7m 0 RWD y
K.O. |
|
822
|
27 Jul 2012 |
Cheng-Ju Lin | Info | MIDAS under Scientific Linux 6 | Hi All,
I was wondering if anyone has attempted to install MIDAS under Scientific Linux 6? I am planning to install
Scientific Linux on one of the PCs in our lab to run MIDAS. I would like to know if anyone has been
successful in getting MIDAS to run under SL6. Thanks.
Cheng-Ju |
|
823
|
31 Jul 2012 |
Pierre-Andre Amaudruz | Info | MIDAS under Scientific Linux 6 | Hi Cheng-Ju,
Midas will install and run under SL6. We're presently running SL6.2.
Cheers, PAA
> Hi All,
>
> I was wondering if anyone has attempted to install MIDAS under Scientific Linux 6? I am planning to install
> Scientific Linux on one of the PCs in our lab to run MIDAS. I would like to know if anyone has been
> successful in getting MIDAS to run under SL6. Thanks.
>
> Cheng-Ju |
|
833
|
05 Sep 2012 |
Stefan Ritt | Info | New pipe compression implemented in mlogger | A new pipe compression has been implemented in mlogger thanks to Fedor Ignatov from BINP
Novosibirsk. The way it works that the logger write into a pipe instead directly into a file. The pipe can
then be connected to any compression program without the need to copile against any additional C
library.
To use is, enter as the filename for example
|bzip2>run%05d.mid (note the pipe '|' in front of the bzip2)
This way the data stream is run through the bzip2 program, which is known to have better compression
ratio than gzip. Furthermore, the parallel version of bzip2 can be used, which spreads over all available
CPU cures and speeds up compression almost linearly with the number of cores. This parallel version
called pbzip2 can be found here:
http://compression.ca/pbzip2/
It can be easily compiled and installed. Using this method in the MEG experiment at PSI, we can compress
our waveform data to 37% or it's original size (49% with gzip), and on 8 cores we get a compression rate
of about 40 MBytes/sec (23 MBytes with gzip on a single core).
The disadvantage of that method is that one cannot see the compression ratio online, but this is not a big
deal I guess. The new version has been committed as rev. 5324.
/Stefan |
|