ID |
Date |
Author |
Topic |
Subject |
|
2395
|
04 May 2022 |
Stefan Ritt | Info | added web pages for "show odb clients" and "show open records" | Concerning the "scl" page, we are currently having a discussion. At the moment, one can
see midas clients in three different places:
1) the main status page at the bottom, only names and hosts are there
2) the programs page, where one can also start/stop program
3) now the new page "Show ODB clients" in the ODB editor page, which shows also the
alive status, PID and timeout
I'm thinking that three locations are two too much, so we are considering to merge the
tree pages into one. That would mean that 1) goes away, and the "Programs" page will
show more information. We have some rare cases that programs are removed from
/System/Clients in the ODB but still attached to the ODB. For those "zombies" we would
add a "hard kill" function.
I would like to hear feedback from the midas community before we proceed with the
plans. Anybody desperately in need of the programs shown on the status page?
Best,
Stefan |
|
2394
|
02 May 2022 |
Stefan Ritt | Info | added web page for "mdump" | Here are some of my thoughts:
- I volunteer to write the JavaScript midas bank decoder. Just a couple of pure javascript functions, no
midasio.cxx library needed.
- If different javascript connections "steal" events from each other, I would not be concerned. Actually I
would rather like that all connections see the SAME event. So mhttpd keeps one event, serves it to all
links, so displays are consistent. If a browser wants to see the "next" event, it send the old serial
number and days "please send next event AFTER serial number". If the serial number is larger than the
event in the buffer, mhttpd fetches a new event and puts it into its buffer.
- Since javascript connections are connectionless, I would rather pass event_id and trigger_mask with each
request. Then mhttpd can retrieve events until event_id and trigger_mask match, then serve that event.
Since reading events from a midas buffer is fast (many 10'000s of events per second), the won't be much of
a delay.
- GET_ALL does not make sense for browsers, you don't want to slow down any frontend. If someone wants to
do histogramming in the browser, then GET_SOME (which is kind of GET_OLD) would make sense, but most of
the cases we have some single event display, and there a GET_RECENT is most appropriate. |
|
2393
|
01 May 2022 |
Giovanni Mazzitelli | Forum | S3 Object Storage | > > We are storing raw MIDAS files to S3 Object Storage, but MIDAS file are not
> > optimised for readout from such kind of storage. There is any work around on
> > evolution of midas raw output or, beyond simulated posix fs, to develop midas
> > python library optimised to stream data from S3 (is not really clear to me if this
> > is possible).
>
> We have plans for adding S3 object storage support to lazylogger, but have not gotten
> around to it yet.
>
> We do not plan to add this in mlogger. mlogger works well for writing data to locally-
> attached storage (local ext4, XFS, ZFS) but always runs into problems with timeouts and
> delays when writing to anything network-attached (even writing to NFS).
>
> I envision that each midas raw data file (mid.gz or mid.lz4 or mid.bz2) will
> be stored as an S3 object and there will be some kind of directory object
> to map object ids to run and subrun numbers.
>
> Choice of best file size is open, normally we use subruns to limit file size to 1-2
> Gbytes. If cloud storage prefers some other object size, we can easily to up to 10
> Gbytes and down to "a few megabytes" (ODB dumps will have to be turned off for this).
>
> Other than that, in your view, what else is needed to optimize midas files for storage
> in the Amazon S3 could?
>
> P.S. For reading files from the cloud, code needs to be written and added to
> midasio/midasio.cxx, for example, see the code that is already there for reading ssh-
> attached files and dcache/dccp-attached files. (CERN EOS files can be read directly
> from POSIX mount point /eos).
>
> K.O.
thanks,
actually a I made a small work around with python boto3 library with file of any size (with
the obviously limitation of opportunity and time to wait) eg:
key = 'TMP/run00060.mid.gz'
aws_session = creds.assumed_session("infncloud-iam")
s3 = aws_session.client('s3', endpoint_url="https://minio.cloud.infn.it/",
config=boto3.session.Config(signature_version='s3v4'),verify=True)
s3_obj = s3.get_object(Bucket='cygno-data',Key=key)
buf = BytesIO(s3_obj["Body"]._raw_stream.data)
for event in MidasSream(gzip.GzipFile(fileobj=buf)):
if event.header.is_midas_internal_event():
print("Saw a special event")
continue
bank_names = ", ".join(b.name for b in event.banks.values())
print("Event # %s of type ID %s contains banks %s" % (event.header.serial_number,
event.header.event_id, bank_names))
....
where in MidasSream I just bypass the open, and the code work, but obviously in this way I
need to have all the buffer in memory and it take time get all the buffer. I was interested to
understand if some one have already develop the stream event by event (better in python but
not mandatory). I'll look to the code you underline.
Thanks, G.
|
|
2392
|
01 May 2022 |
Konstantin Olchanski | Info | added web page for "mdump" | > added a web page for "mdump".
missing functions:
- get a list of existing event buffers (should read event buffer names from /Experiment/Buffer sizes)
- selector box to select event buffer
- button for "get next" and "get new" (should call bm_skip_event() before bm_receive_event())
- entry fields for event_id and trigger_mask event filter
- check box for "keep getting new data" and entry field for update frequency
- (eventually) entry field for bank name filter
K.O. |
|
2391
|
01 May 2022 |
Konstantin Olchanski | Info | added web page for "mdump" | > added JSON RPC for bm_receive_event()
there is a number of problems with implementing bm_receive_event() as a RPC:
1) mhttpd has only event buffer 1 read pointer for all javascript connections, if two browser tabs are
running mdump, they will "steal" events from each other.
2) javascript connections are state-less and we cannot specify per-connection event_id and trigger_mask
filters to bm_receive_event(). our bm_request_event() has to be for all event_id and all trigger_mask.
3) for same reason, we cannot have some requests to be GET_ALL, some to be GET_RECENT and some to be
GET_OLD (if GET_OLD is ever implemented).
Problem (1) is hard to fix. Only solution I can see is to have mhttpd have it's own event buffer that can
somehow track which events have been sent to which javascript connection.
The same scheme allows implementing GET_ALL and per-connection event_id and trigger_mask filters.
The difficulty is in detecting javascript connections that are no longer active and it's event request and
events we have buffered for it can be deleted. Unlike proper rpc clients, javascript browser tabs can be
closed without warning and without opportunity to tell rpc server that they are closed, gone.
K.O. |
|
2390
|
01 May 2022 |
Konstantin Olchanski | Info | added web page for "mdump" | added JSON RPC for bm_receive_event() and added a web page for "mdump".
the event dump is a hex dump for now.
if somebody can contribute a javascript decoder for midas bank format, it would be greatly appreciated.
otherwise, I will eventually write my own decoder library patterned on midasio.h and midasio.cxx.
as of commit 5882d55d1f5bbbdb0d9238ada639e63ac27d8825
K.O. |
|
2389
|
30 Apr 2022 |
Konstantin Olchanski | Info | added web pages for "show odb clients" and "show open records" | for a long time, midas web pages have been missing the equivalent of odbedit
"scl" and "sor" to display current odb clients and current odb open records.
this is now added as buttons "show open records" and "show odb clients" in the
odb editor page.
as in odbedit, "sor" shows open records under the current subtree, i.e. if you
are looking at /equipment, you will not see open records for /experiment. to see
all open records, go to "/".
commit b1ab7e67ecf785744fff092708d8389f222b14a4
K.O. |
|
2388
|
30 Apr 2022 |
Konstantin Olchanski | Forum | S3 Object Storage | > We are storing raw MIDAS files to S3 Object Storage, but MIDAS file are not
> optimised for readout from such kind of storage. There is any work around on
> evolution of midas raw output or, beyond simulated posix fs, to develop midas
> python library optimised to stream data from S3 (is not really clear to me if this
> is possible).
We have plans for adding S3 object storage support to lazylogger, but have not gotten
around to it yet.
We do not plan to add this in mlogger. mlogger works well for writing data to locally-
attached storage (local ext4, XFS, ZFS) but always runs into problems with timeouts and
delays when writing to anything network-attached (even writing to NFS).
I envision that each midas raw data file (mid.gz or mid.lz4 or mid.bz2) will
be stored as an S3 object and there will be some kind of directory object
to map object ids to run and subrun numbers.
Choice of best file size is open, normally we use subruns to limit file size to 1-2
Gbytes. If cloud storage prefers some other object size, we can easily to up to 10
Gbytes and down to "a few megabytes" (ODB dumps will have to be turned off for this).
Other than that, in your view, what else is needed to optimize midas files for storage
in the Amazon S3 could?
P.S. For reading files from the cloud, code needs to be written and added to
midasio/midasio.cxx, for example, see the code that is already there for reading ssh-
attached files and dcache/dccp-attached files. (CERN EOS files can be read directly
from POSIX mount point /eos).
K.O. |
|
2387
|
30 Apr 2022 |
Giovanni Mazzitelli | Forum | S3 Object Storage | Dear all,
We are storing raw MIDAS files to S3 Object Storage, but MIDAS file are not
optimised for readout from such kind of storage. There is any work around on
evolution of midas raw output or, beyond simulated posix fs, to develop midas
python library optimised to stream data from S3 (is not really clear to me if this
is possible). |
|
2386
|
24 Apr 2022 |
Konstantin Olchanski | Bug Fix | mserver buffer overrun and crash | There is a memory allocation bug in the mserver.
ALIGN8() was missing when receiving events from the event socket and data buffer
was allocated 4 bytes too short. but only for some received events and only in
very unlucky sequence of received events. result was a rare but obnoxious crash
of fevme frontend in alpha-2 at CERN. (we do not see any crash from this in
alpha-g or anywhere else, the best I can tell).
fixed in commit 4dc06ba47ff7caa5251fd8c48d8533f35799f3a6.
If you use the mserver, please update to this commit or apply following patch in
midas.cxx:
- int bufsize = sizeof(INT) + event_size;
+ int bufsize = sizeof(INT) + total_size;
K.O. |
|
2385
|
15 Apr 2022 |
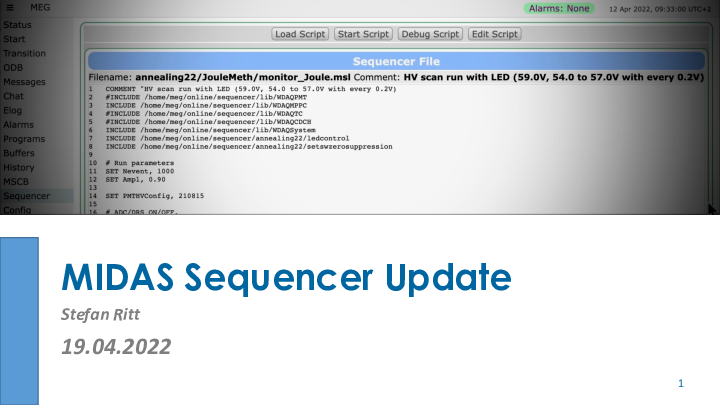
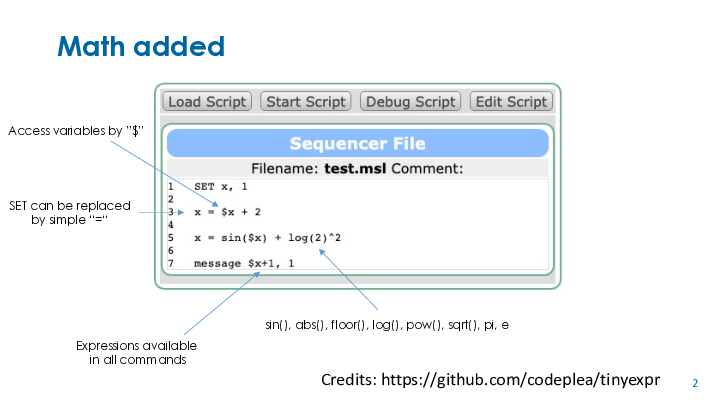
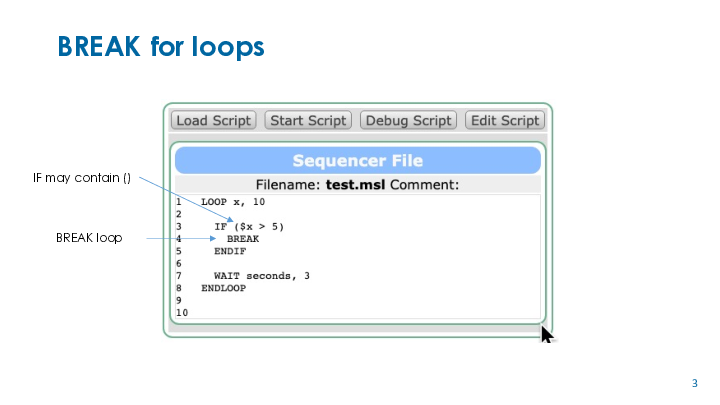
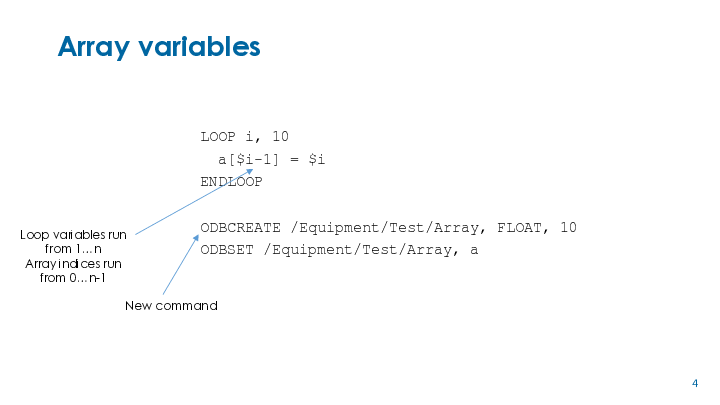
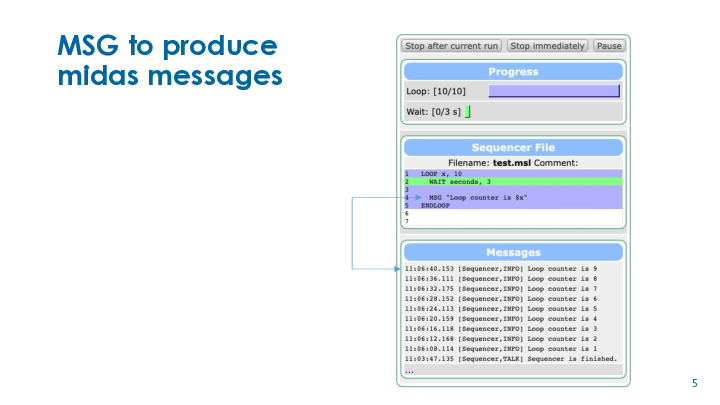
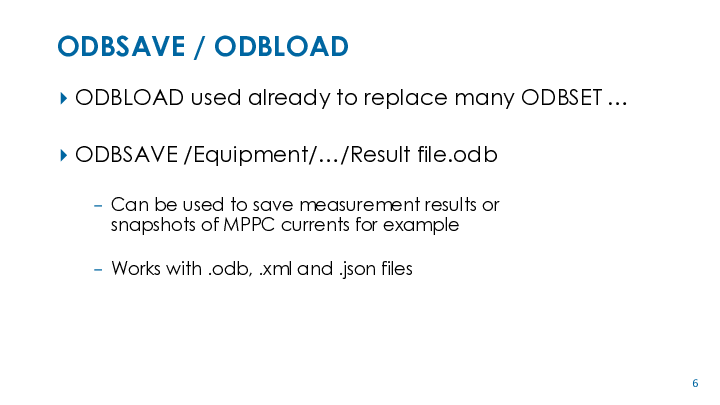
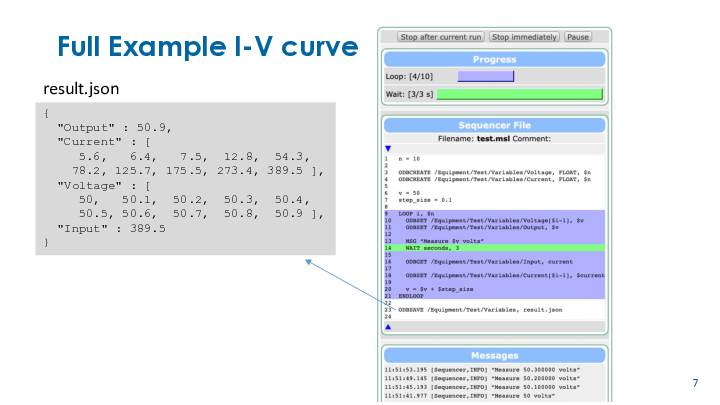
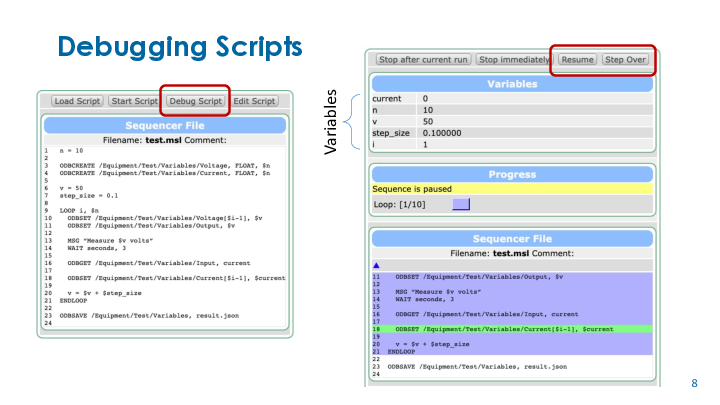
Stefan Ritt | Info | New midas sequencer version | I prepared some slides about the new features of the sequencer and post it here so
people can have a quick look at get some inspiration.
Stefan |
| Attachment 1: sequencer.pdf
|
|
|
2384
|
13 Apr 2022 |
Konstantin Olchanski | Info | ODB JSON support | > > Per xkcd, there is a new json standard "json5". In addition to other things, numeric
> > values NaN, +Infinity and -Infinity are encoded as literals NaN, Infinity and -Infinity (without quotes):
> > https://spec.json5.org/#numbers
>
> Just for curiosity: Is this implemented by the midas json library now?
MIDAS encodes NaN, Infinity and -Infinity as javascript compatible "NaN", "Infinity" and "-Infinity",
this encoding is popular with other projects and allows correct transmission of these values
from ODB to javascript. The test code for this is on the MIDAS "Example" page, scroll down
to "Test nan and inf encoding".
I think this type of encoding, using strings to encode special values, is more in the spirit of json,
compared to other approaches such as adding special literals just for a few special cases
leaving other special cases in the cold (ieee-754 specifies several different types of NaN,
you can encode them into different nan-strings, but not into the one nan-literal (need more nan-literals,
requires change to the standard and change to every json parser).
As editorial comment, it boggles my mind, what university or kindergarden these people went to
who made the biggest number, the smallest number and the imaginary number (sqrt(-1))
all equal to zero (all encoded as literal null).
K.O. |
|
2383
|
13 Apr 2022 |
Stefan Ritt | Info | ODB JSON support | > Per xkcd, there is a new json standard "json5". In addition to other things, numeric
> values NaN, +Infinity and -Infinity are encoded as literals NaN, Infinity and -Infinity (without quotes):
> https://spec.json5.org/#numbers
Just for curiosity: Is this implemented by the midas json library now? |
|
2382
|
12 Apr 2022 |
Konstantin Olchanski | Info | ODB JSON support | > > > > odbedit can now save ODB in JSON-formatted files.
> > encode NaN, Inf and -Inf as JSON string values "NaN", "Infinity" and "-Infinity". (Corresponding to the respective Javascript values).
> http://docs.oasis-open.org/odata/odata-json-format/v4.0/os/odata-json-format-v4.0-os.html
> > Values of types [...] Edm.Single, Edm.Double, and Edm.Decimal are represented as JSON numbers,
> except for NaN, INF, and �INF which are represented as strings "NaN", "INF" and "-INF".
> https://xkcd.com/927/
Per xkcd, there is a new json standard "json5". In addition to other things, numeric
values NaN, +Infinity and -Infinity are encoded as literals NaN, Infinity and -Infinity (without quotes):
https://spec.json5.org/#numbers
Good discussion of this mess here:
https://stackoverflow.com/questions/1423081/json-left-out-infinity-and-nan-json-status-in-ecmascript
K.O. |
|
2381
|
04 Apr 2022 |
Konstantin Olchanski | Suggestion | Maximum ODB size | > Anybody some idea what the maximum ODB size can be?
It turns out ODB size limit is hardwired on db_open_database() at 100 Mbytes.
I now committed an improved error message for this.
I confirm that "odbinit -s 100MB" works and creates ODB with 50 Mbyte data area and 50
Mbyte key area.
> in the age of 64GB RAM being a standard, we should be able to grow bigger ...
I agree, I think we can safely bump the limit from 100 Mbytes to 1 Gbyte, maybe 1.5 or
1.99 Gbytes. Above that we run into 32-bit/31-bit cleanliness problems.
And creating extra large 1 GB ODB but using only a few megabytes will not waste any
RAM, because the .ODB.SHM file is demand-paged and non-used parts of ODB will not be
mapped into RAM. (It will waste disk space, file .ODB.SHM will be 1 GByte size).
However, 1 GByte (FPGA based) and 4-8 GByte (Raspberry Pi & co) machines are again
becoming popular and relevant for running MIDAS, and they have very slow "disk"
subsystems, with NAND, SD and USB flash, so we should not go crazy here.
> odbinit -s 1024MB --cleanup
there is a bug in odbinit, if initial odbinit fails, ODB with default size is creates,
and original rejected ODB size is written to .ODB_SIZE.TXT (an inconsistency).
bitbucket bug 328
> [ how do I resize ODB ??? ]
we need odbresize. bitbucket bug 329.
K.O. |
|
2380
|
31 Mar 2022 |
Stefan Ritt | Suggestion | Maximum ODB size | Anybody some idea what the maximum ODB size can be? In the old days, the linux
kernels had a severe limit on shared memory of usually 8MB, but in the age of
64GB RAM being a standard, we should be able to grow bigger. Tried
odbinit -s 1024MB --cleanup
which went through without complain, even put that value in to .ODB_SIZE.TXT, but
when I started odbedit doing "mem", I only see a size of 1MB. Probably somewhere
deep inside we have a limit which prevents the user to create very large ODBs,
but this should be mentioned more prominently in odbinit. Like "size too large,
maximum allowd is xxx MB".
Stefan |
|
2379
|
31 Mar 2022 |
Konstantin Olchanski | Bug Fix | "run stop" trouble in mlogger, fixed | while debugging something else, I ran into a bit of trouble in mlogger.
I set the mlogger event limit to 100, and after reaching 100 events, mlogger
sayd "stopping run", but nothing happened, run kept going.
it turns out mlogger tried stopping the run too soon, the run-start
transition did not finish yet and the error message about trying
to stop a run while another transition is in progress was missing.
(fixed - if another transition is in progress, we try again later)
it also turns out that cm_transition() checks if another transition
is in progress way too late, all the way in the transition thread,
where it cannot return it is an error to mlogger.
(fixed - first thing done in cm_transition() is this check).
while debugging this, I tested the ODB flags "/Logger/Async transitions"
and /Logger/Multithread transitions". It turns out only two transition
types still work from inside mlogger - multithread transition
and detached transition (via the mtransition helper).
the issue is the dead lock between mlogger and frontend. while mlogger
is inside cm_transition(), it is not reading the SYSTEM buffer,
while at the same time frontends are writing into it. If SYSTEM
buffer happens to be pretty full, we dead lock - frontends are waiting
for free space in the SYSTEM buffer do not respond to RPCs, mlogger is not
reading from the SYSTEM and it stuck trying to issue "run stop" RPC
to frontend. (this dead lock is not forever, eventually frontend
is killed by RPC timeout, mlogger survives and stops the run).
this is a well known problem and as solution, mlogger has been using the
multithreaded transitions for years.
now I removed the OBD /Logger/Async transition and /Logger/Multithread
transition flags, instead, there is now a flag /Logger/Detached transitions
set to FALSE by default. Setting it to TRUE will cause mlogger to fork
"mtransition STOP" and "mtransition START" for stopping and starting runs,
this is useful in case there is trouble with multithreading in mlogger.
K.O. |
|
2378
|
30 Mar 2022 |
Konstantin Olchanski | Bug Fix | erroneous removal of odb clients, fixed | commit https://bitbucket.org/tmidas/midas/commits/b1fe21445109774be3f059c2124727b414abf835
made on 2022-02-21 fixed a serious bug in ODB.
a multithread race condition against an incorrectly updated shared variable caused removal of
random clients from ODB with error message:
My client index %d in ODB is invalid: out of range 0..%d. Maybe this client was removed by a
timeout, see midas.log. Cannot continue, aborting...
the race is between db_open_database() in one program (executed when any midas program starts) and
db_get_my_client_locked() in all running midas programs.
as long as no midas programs are started (db_open_database() is not executed), this bug does not
happen.
if i.e. odbedit is executed very often, i.e. from a script, probability of hitting this bug becomes
quite high.
fixed now.
K.O. |
|
2377
|
29 Mar 2022 |
Konstantin Olchanski | Bug Fix | mdump can read lz4 and bz2 files now | I converted mdump file i/o from older mdsupport library to newer midasio library
and it can now read .mid, .mid.gz, .mid.lz4 and .mid.bz2 files. Output should be
identical to what it printed before, if you see any differences, please report
them here or on bitbucket. K.O. |
|
2376
|
29 Mar 2022 |
Hunter Lowe | Forum | Triggering without LAM signal - mcstd_libgpmc_camac driver | Hello,
I have a question for anyone experienced with simple CAMAC systems.
My understanding is that for a single ADC system you can use a gate to generate a
LAM signal for triggering on ADC.
The driver that I have "mcstd_libgpmc_camac" has LAM "not implemented" though,
so I'm not sure how I should trigger DAQ. The frontend code that I have seems to use a TDC
as trigger for ADC via "EQ_POLLED" type equipment setting. Should I simply plug in TDC in my
system and use this as trigger? Is it as simple as TDC generates signal via gate and ADC performs job?
Sorry if question is super basic, just confused how to trigger without LAM signal.
Thank you :)
Hunter Lowe
UNBC Grad Physics |
|