 21 May 2009, Konstantin Olchanski, Info, mhttpd now uses mtransition 21 May 2009, Konstantin Olchanski, Info, mhttpd now uses mtransition
|
> mhttpd function for starting and stopping runs now uses cm_transition(DETACH) which spawns an
> external helper program called mtransition to handle the transition sequencing.
>
> P.S. In one of our experiments, I sometimes see mhttpd getting "stuck" when starting or stopping a run
> using this feature. strace shows it is stuck in repeated calls to wait(), but I am unable to reproduce this
> problem in a test system and it happens only sometimes in the experiment. When it does, mhttpd has to
> be restarted. Replacing system("mtransition ...") with ss_sysem("mtransition ...") seems to fix this problem,
> but there are downsides to this (mtransition debug output vanishes) so I am not committing this yet.
> K.O.

Found the problem. As observed on SL5 systems, the GLIBC "system()" function breaks if the user application
installs a SIGCHLD handler that "steals" wait() notifications. Such a handler is installed by the MIDAS ss_exec()
function in system.c.

I would count this as a GLIBC bug - their "system()" function should survive in the presence of non-default signal
handlers installed by the user, and in fact my copy of "man signal" talks about the "system()" doing something
special about SIGCHLD. Obviously whatever they do is broken, at least in the SL5 GLIBC.

I am now testing an implementation using MIDAS ss_spawnvp().

The simplest way to reproduce the problem: start mhttpd; start/stop runs - mtransition works perfectly; start some
program from the MIDAS "programs" page (this calls "ss_exec()"), try to start a run - mhttpd will hang inside the
system() GLIBC function, every time. mhttpd has to be killed with "kill -KILL" to recover.

K.O. |
|
02 Jun 2009, Konstantin Olchanski, Info, mhttpd now uses mtransition
|
> > mhttpd function for starting and stopping runs now uses cm_transition(DETACH) which spawns an
> > external helper program called mtransition to handle the transition sequencing.
>
> ... the GLIBC "system()" function breaks if the user application
> installs a SIGCHLD handler that "steals" wait() notifications. Such a handler is installed by the MIDAS ss_exec()
> function in system.c.
>
> I am now testing an implementation using MIDAS ss_spawnvp().

cm_transition() starting mtransition helper using ss_spawnvp() committed svn rev 4495.

K.O. |
|
02 Jun 2009, Konstantin Olchanski, Info, RPC.SHM gyration
|
> When using remote midas clients with mserver, you may have noticed the zero-size .RPC.SHM files
> these clients create in the directory where you run them. These files are associated with the semaphore
> created by the midas rpc layer (rpc_call) to synchronize rpc calls between multiple threads. This
> semaphore is always created, even for single-threaded midas applications. Also normally midas
> semaphore files are created in the midas experiment directory specified in exptab (same place as
> .ODB.SHM), but for remote clients, we do not know that location until we start making rpc calls, so the
> semaphore file is created in the current directory (and it is on a remote machine anyway, so this
> location may not be visible locally).
>
> There are 2 problems with these semaphores:

A 3rd problem surfaced - on SL5 Linux, the global limit is 128 or so semaphores and on at least one heavily used machine that hosts multiple
experiments we simply run out of semaphores.

For "normal" semaphores, their number is fixed to about 5 per experiment (one for each shared memory buffer), but the number of RPC
semaphores is not bounded by the number of experiments or even by the number of user accounts - they are created (and never deleted) for
each experiment, for each user that connects to each experiment, for each subdirectory where the each user happened to try to start a
program that connects to the each experiment. (to reuse the old children's rhyme).

Right now, MIDAS does not have an abstraction for "local multi-thread mutex" (i.e. pthread_mutex & co) and mostly uses global semaphores
for this task (with interesting coding results, i.e. for multithreaded locking of ODB). Perhaps such an abstraction should be introduced?

K.O. |
|
04 Jun 2009, Stefan Ritt, Info, RPC.SHM gyration
|
> Right now, MIDAS does not have an abstraction for "local multi-thread mutex" (i.e. pthread_mutex & co) and mostly uses global semaphores
> for this task (with interesting coding results, i.e. for multithreaded locking of ODB). Perhaps such an abstraction should be introduced?

Yes. In the old days when I designed the inter-process communication (~1993), there was no such thing like pthread_mutex (only under Windows).
Now it would be time to implement this thing, since it then will work under Posix and Windows (don't know about VxWorks). But that will at least
allow multi-threaded client applications, which can safely call midas functions through the RPC layer. For local thread-safeness, all midas
functions have to be checked an modified if necessary, which is a major work right now, but for remote clients it's rather simple. |
|
26 Jun 2009, Konstantin Olchanski, Info, mhttpd now uses mtransition
|
> > > mhttpd function for starting and stopping runs now uses cm_transition(DETACH) which spawns an
> > > external helper program called mtransition to handle the transition sequencing.

Problem reported by Stefan - user presses the "stop the run" button, and the web page comes back saying "running" as if the button did not work. This is
confusing. It happens because mtransition did not start yet - we have a race condition against it.

To improve this situation, mhttpd now remembers that a start/stop button was pushed and displays a message "Run start/stop requested" until it detects
that mtransition started and set "runinfo/transition in progress" (or the run state changed).

svn rev 4520
K.O. |
 10 Aug 2009, Konstantin Olchanski, Info, misc changes from PIENU and T2K 10 Aug 2009, Konstantin Olchanski, Info, misc changes from PIENU and T2K
|
FYI - committed the last changes from TRIUMF DAQ systems for PIENU and T2K/ND280 FGD and TPC
tests:

- mhttpd: add <odb xxx format="%d">xxx</odb>, similar to AJAX ODBget() method
- alarm.c: if alarm stops the run, log a message (sometimes it is hard to tell "why did this run stop?!?")
use DETACH transition (was ASYNC - does not follow requested transition sequencing, now calls
mtransition helper). Also verified that alarm handler always runs on the main computer - for remote
clients, alarms are processed inside the corresponding mserver process.
- midas.c: event buffer fixes:
-- mserver 100% cpu busy loop if event buffer is full
-- consolidate event buffer cleanup into one routine. do things similar to odb cleanup - check for client
pid, etc.
-- do not kill clients that have the watchdog timeout set to zero.

svn rev 4541
K.O. |
|
10 Aug 2009, Konstantin Olchanski, Info, misc changes from PIENU and T2K
|
> FYI - committed the last changes from TRIUMF DAQ systems for PIENU and T2K/ND280 FGD and TPC
> tests:
> svn rev 4541

Also:

- add traps to event buffer code to catch event buffer (shared memory) corruption observed in PIENU
- dynamically allocate some RPC network data buffers to permit better communication between MIDAS clients built with different values of
MAX_EVENT_SIZE (in T2K/ND280 the default 4 Mbytes is too small for some users, while other users use the default size - this change permits all
these programs to talk to each other).

K.O. |
|
21 Sep 2009, Stefan Ritt, Info, New feature: Stop run after a certain time
|
A new feature has been implemented in revision 4561 which allows runs with a
certain duration. To use this, one has to set the variaable

/Logger/Run Duration

to a non-zero value in seconds. After a run lasted for this duration, it gets
stopped automatically by the logger. If the auto-restart flag is on, this allows
sequences of automatically started and stopped runs with all then have the same
duration. |
|
22 Sep 2009, Stefan Ritt, Info, New feature: Stop run after a certain time
|
> A new feature has been implemented in revision 4561 which allows runs with a
> certain duration. To use this, one has to set the variaable
>
> /Logger/Run Duration
>
> to a non-zero value in seconds. After a run lasted for this duration, it gets
> stopped automatically by the logger. If the auto-restart flag is on, this allows
> sequences of automatically started and stopped runs with all then have the same
> duration.

A similar scheme has been implemented to pose a certain duration on subruns. This can
be controlled by the variable

/Logger/Subrun duration

when set to a non-zero value in seconds. |
|
11 Oct 2009, Konstantin Olchanski, Info, SQL history documentation
|
> Documentation for writing midas history data to SQL (mysql) is now documented in midas doxygen files
> (make dox; firefox doxfiles/html/index.html). The corresponding logger and mhttpd code has been
> committed for some time now and it is used in production environment by the t2k/nd280 slow controls
> daq system at TRIUMF.
> svn rev 4487


An updated version of the SQL history code is now committed to midas svn.

The new code is in history_sql.cxx. It implements a C++ interface to the MIDAS history (history.h),
and improves on the old code history_odbc.cxx by adding:
- an index table for remembering MIDAS names of SQL tables and columns (our midas users like to use funny characters in history
names that are not permitted in SQL table and column names),
- caching of database schema (event names, etc) with a noticeable speedup of mhttpd (there is a new button on the history panel editor
"clear history cache" to make mhttpd reload the database schema.

The updated documentation for using SQL history is committed to midas svn doxfiles/internal.dox (svn up; make dox; firefox
doxfiles/html/index.html), or see my copy on the web at
http://ladd00.triumf.ca/~olchansk/midas/Internal.html#History_sql_internal

svn rev 4595
K.O. |
|
20 Nov 2009, Konstantin Olchanski, Info, RPC.SHM gyration
|
> When using remote midas clients with mserver, you may have noticed the zero-size .RPC.SHM files
> these clients create in the directory where you run them.

Well, RPC.SHM bites. Please reread the parent message for full details, but in the nutshell, it is a global
semaphore that permits only one midas rpc client to talk to midas at a time (it was intended for local
locking between threads inside one midas application).

I have about 10 remote midas frontends started by ssh all in the same directory, so they all share the same
.RPC.SHM semaphore and do not live through the night - die from ODB timeouts because of RPC semaphore contention.

In a test version of MIDAS, I disabled the RPC.SHM semaphore, and now my clients live through the night, very
good.

Long term, we should fix this by using application-local mutexes (i.e. pthread_mutex, also works on MacOS, do
Windows have pthreads yet?).

This will also cleanup some of the ODB locking, which currently confuses pid's, tid's etc and is completely
broken on MacOS because some of these values are 64-bit and do not fit into the 32-bit data fields in MIDAS
shared memories.

Short term, I can add a flag for enabling and disabling the RPC semaphore from the user application: enabled
by default, but user can disable it if they do not use threads.

Alternatively, I can disable it by default, then enable it automatically if multiple threads are detected or
if ss_thread_create() is called.

Could also make it an environment variable.

Any preferences?

K.O. |
01 Dec 2009, Stefan Ritt, Info, Redesign of status page links 
|
The custom and alias links in the standard midas status page were shown as HTML
links so far. If there are many links with names having spaces in their names,
it's a bit hard to distinguish between them. Therefore, they are packed now into
individual buttons (see attachment) starting from SVN revision 4633 on. This makes
also the look more homogeneous. If there is any problem with that, please report. |
|
04 Dec 2009, Stefan Ritt, Info, Redesign of status page columns
|
Since the column on the main midas status page with fraction of analyzed events is
barely used, I decided to drop it. Anyhow it does not make sense for all slow
control events. If this feature is required in some experiment, I propose to move it
into a custom page and calculate this ratio in JavaScript, where one has much more
flexibility.

This modification frees up more space on the status page for the "Status" column, where
front-end programs can report errors etc. |
|
04 Dec 2009, Stefan Ritt, Info, Custom page showing ROOT analyzer output
|
Many midas experiments work with ROOT based analyzers today. One problem there is that the graphical output of the root analyzer can only be seen through the X server and not through the web. At the MEG experiment, we solved this problem in an elegant way: The ROOT analyzer runs in the background, using a "virtual" X server called Xvfb. It plots its output (several panels) normally using this X server, then saves this panels every ten seconds into GIF files. These GIF files are then served through mhttpd using a custom page. The output looks like this:

The buttons on the left sides are actually HTML buttons on that custom page overlaid to the GIF image, which in this case shows one of our 800 PMT channels digitized at 1.6 GSPS. With these buttons one can cycle through the different GIF images, which then automatically update ever ten seconds. Of course it is not possible to feed interaction back to the analyzer (like the waveform cannot be fitted interactively) but for monitoring an experiment in production mode this tools is extremely helpful, since it is seamlessly integrated into mhttpd. All the magic is done with JavaScript, and the buttons are overlaid to the graphics using CSS with absolute positioning. The analysis ratio on the top right is also done with JavaScript pulling the right info out of the ODB.
The used custom page file is attached. For details using Xvfb server, please contact Ryu Sawada <sawada@icepp.s.u-tokyo.ac.jp>. |
|
04 Dec 2009, Stefan Ritt, Info, New '/Experiment/Menu buttons'
|
The mhttpd program shows some standard buttons in the top row for
starting/stopping runs, accessing the ODB, Alarms, etc. Since not all experiments
make use of all buttons, they have been customized. By default mhttpd creates
following entry in the ODB:

/Experiment/Menu Buttons = Start, ODB, Messages, ELog, Alarms, Programs, History,
Config, Help

Which is the standard set (except the old CNAF). People can customize this now by
removing unnecessary buttons or by changing their order. The "Start" entry above
actually causes the whole set of Start/Stop/Pause/Resume buttons to appear,
depending on the current run state. |
|
12 Dec 2009, Stefan Ritt, Info, New MSCB page implementation
|
A new page has been implemented in mhttpd. This allows web access to all devices from an MSCB system and their variables:
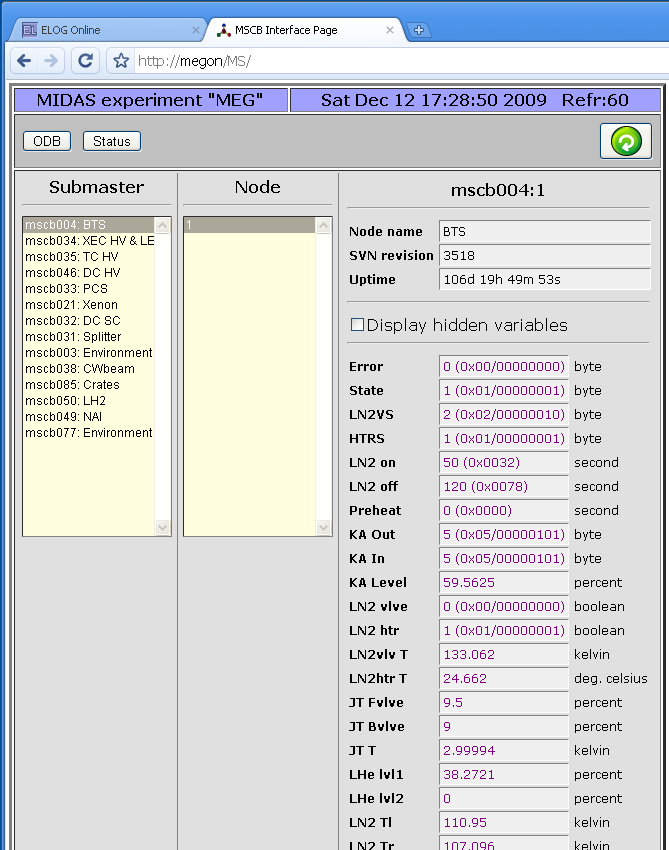
All you need to turn on the magic is to add a -DHAVE_MSCB to your Makefile for mhttpd. This is now the default in the Makefile from SVN, but it can be taken out for experiments not using MSCB. If it's present, mhttpd is linked against midas/mscb/mscb.c and gets direct access to all mscb ethernet submasters (USB access is currently disabled on purpose there). To show the MSCB button on the status page, you need following ODB entry:
/Experiment/Menu Buttons = Start, ODB, Messages, ELog, Alarms, Programs, History, MSCB, Config, Help
containing the "MSCB" entry in the list. If there is no "Menu Buttons" entry present in the ODB, mhttpd will create the above one, if it's compile with the -DHAVE_MSCB flag.
The MSCB page use the ODB Tree /MSCB/Submasters/... to get a list of all available submasters:
[local:MEG:R]/MSCB>ls -r
MSCB
    Submaster
        mscb004
            Pwd                 xxxxx
            Comment             BTS
            Address             1
        mscb034
            Pwd                 xxxxx
            Comment             XEC HV & LED
            Address
                                0
                                1
                                2
Each submaster tree contains an optional password needed by that submaster, an optional comment (which just gets displayed on the 'Submaster' list on the web page), and an array of node addresses.
These trees can be created by hand, but they are also created automatically by mhttpd if the /MSCB/Submaster entry is not present in the ODB. In this case, the equipment list is scanned and all MSCB devices and addresses are collected from locations such as
/Equipment/<name>/Settings/Devices/Input/Device
or
/Equipment/<name>/Settings/Devices/<name>/MSCB Device
which are the locations for MSCB submasters used by the mscbdev.c and mscbhvr.c device drivers. Once the tree is created, it does not get touched again by mhttpd, so one can remove or reorder devices by hand.
The new system is currently successfully used at PSI, but I cannot guarantee that there are not issues. So in case of problems don't hesitate to contact me. |
|
04 Mar 2010, Konstantin Olchanski, Info, Notes on MIDAS Alarm system
|
Notes on the implementation of the MIDAS alarm system.

Alarms are checked inside alarm.c::al_check(). This function is called by
cm_yield() every 10 seconds and by rpc_server_thread(), also every 10 seconds.

For remote midas clients, their al_check() issues an RPC_AL_CHECK RPC call into
the mserver, where rpc_server_dispatch() calls the local al_check().

As result, all alarm checks run inside a process directly attached to the local
midas shared memory (inside a local client or inside an mserver process for a
remote client).

Each and every midas client runs the alarm checks. To prevent race conditions
between different midas clients, access to al_check() is serialized using the
ALARM semaphore.

Inside al_check(), alarms are triggered using al_trigger_alarm(), which in turn
calls al_trigger_class(). Inside al_trigger_class(), the alarm is recorded into
an elog or into midas.log using cm_msg(MTALK).

Special note should be made of the ODB setting "/Alarm/Classes/xxx/System
message interval", which has a surprising effect - after an alarm is recorded
into system messages (using cm_msg(MTALK)), no record is made of any subsequent
alarms until the time interval set by this variable elapses. With default value
of 60 seconds, after one alarm, no more alarms are recorded for 60 seconds.
Also, because all the alarms are checked at the same time, only the first
triggered alarm will be recorded.

As of alarm.c rev 4683, "System message interval" set to 0 ensures that every
alarm is recorded into the midas log file. (In previous revisions, this setting
may still miss some alarms).

There are 3 types of alarms:

1) "program not running" alarms.

These alarms are enabled in ODB by setting "/Programs/ppp/Alarm class". Each
time al_check() runs, every program listed in "/Programs" is tested using
"cm_exist()" and if the program is not running, the time of first failure is
remembered in "/Programs/ppp/First failed".

If the program has not been running for longer than the time set in ODB
"/Programs/ppp/Check interval", an alarm is triggered (if enabled by
"/Programs/ppp/Alarm class" and the program is restarted (if enabled by
"/Programs/ppp/Auto restart").

The "not running" condition is tested every 10 seconds (each time al_check() is
called), but the frequency of "program not running" alarms can be reduced by
increasing the value of "/Alarms/Alarms/ppp/Check interval" (default value 60
seconds). This can be useful if "System message interval" is set to zero.

2) "evaluated" alarms
3) "periodic" alarms

There is nothing surprising in these alarms. Each alarm is checked with a time
period set by "/Alarm/xxx/Check interval". The value of an evaluated alarm is
computed using al_evaluate_condition().

K.O. |
|
11 Mar 2010, Stefan Ritt, Info, New '/Experiment/Menu buttons'
|
> The mhttpd program shows some standard buttons in the top row for
> starting/stopping runs, accessing the ODB, Alarms, etc. Since not all experiments
> make use of all buttons, they have been customized. By default mhttpd creates
> following entry in the ODB:
>
> /Experiment/Menu Buttons = Start, ODB, Messages, ELog, Alarms, Programs, History,
> Config, Help
>
> Which is the standard set (except the old CNAF). People can customize this now by
> removing unnecessary buttons or by changing their order. The "Start" entry above
> actually causes the whole set of Start/Stop/Pause/Resume buttons to appear,
> depending on the current run state.

Upon request the set of Menu Buttons has been extended to

/Experiment/Menu Buttons = Start, Pause, ODB, Messages, ELog, Alarms, Programs,
History, Config, Help

by adding the additional "Pause" string. Without "Pause" being present in the list of
menu buttons, the run cannot be paused/resumed, but only started/stopped. This is
required by some experiments. If "/Experiment/Menu Buttons" is not present in the ODB,
it gets created with the above default. If it is there from the previous update, the
"Pause" string might be missing, so it must be added by hand if required. The
modification is committed as revision #4684. |
|
30 Jul 2010, Konstantin Olchanski, Info, macos 10.6 success
|
As of svn rev 4794, midas builds, runs and should be fully usable on MacOS 10.6.4. Previous revisions did
not compile due to assorted Linuxisms and did not run because of a sizeof() problem in ss_gettid(). Also
one of the system header files (mtio.h?) present in MacOS 10.5 vanished from 10.6.

Please continue reporting all problems with midas on macos to this forum.
K.O. |
|
04 Aug 2010, Konstantin Olchanski, Info, YBOS support now optional, disabled by default
|
As of svn rev 4800, YBOS support was made optional, disabled by default. (But note that ybos.c is still used
by mdump). See HAVE_YBOS in the Makefile.
K.O. |
|