 23 Jul 2019, Yusuke Uchiyama, Forum, Change of MIDAS library path 23 Jul 2019, Yusuke Uchiyama, Forum, Change of MIDAS library path
|
Dear all,

From the recent release of MIDAS, "midas-2019-06", the MIDAS library path is changed:
it was $MIDASSYS/linux/lib, but now $MIDASSYS/lib.
See https://midas.triumf.ca/elog/Midas/1564 for the detail.

Due to this change, ROME analyzers cannot be built with -midas option.

The solution seems easy: change the path in
$ROMESYS/buildersrc/ROMEBuilderMakeFile.cpp AddDAQLibraries().
However, directly changing the code will loose backward compatibility.
Do you have any suggestions?

Regards,
Yusuke |
|
28 Feb 2018, Francesco Renga, Forum, DB path
|
Dear all,
I need to perform a DB query in ROME, where I have to select an array of |
|
29 Nov 2017, Yusuke Uchiyama, Info, Compiler warning
|
Dear all,

Under the environment with GCC4.8.5 and ROOT6.08.04,
we get the following warning messages when compiling XXXAnalyzer3, XXXAnalyzer4,
XXXConfig, XXXConfig2,3,4, XXXDBAccess, and XXXConfigToForm.


In file included from /usr/include/stdlib.h:24:0,
                 from /meg/data1/shared/mc/benchmark_test/rome3-root6.08.04-
gcc485/include/ROMEAnalyzer.h:10,
                 from include/generated/MEGPrecompile.h:23,
                 from <command-line>:0:
/usr/include/features.h:330:4: warning: #warning _FORTIFY_SOURCE requires compiling
with optimization (-O) [-Wcpp]
 #  warning _FORTIFY_SOURCE requires compiling with optimization (-O)
    ^
[345/369] compiling obj/MEGAnalyzer4.o
In file included from /usr/include/stdlib.h:24:0,
                 from /meg/data1/shared/mc/benchmark_test/rome3-root6.08.04-
gcc485/include/ROMEAnalyzer.h:10,
                 from include/generated/MEGPrecompile.h:23,
                 from <command-line>:0:
/usr/include/features.h:330:4: warning: #warning _FORTIFY_SOURCE requires compiling
with optimization (-O) [-Wcpp]
 #  warning _FORTIFY_SOURCE requires compiling with optimization (-O)
    ^

It seems due to 'NOOPT' flag added to those objects in the Makefile.
Is the 'NOOPT' flag necessary? If not, how can we remove it?

Regards,
Yusuke |
 29 Nov 2017, Ryu Sawada, Info, Compiler warning 29 Nov 2017, Ryu Sawada, Info, Compiler warning
|
Hi Yusuke

NOOPT is added for potentially large source files to reduce the compile time and memory usage.

I guess -D_FORTIFY_SOURCE option is added in your project Makefile or in your environment variable, instead of by
ROME.
However, we could modify ROME to explicitly disable it by adding -D_FORTIFY_SOURCE=0 to NOOPT.
That can be done by modifying builder/src/ROMEBuildMakeFile.cpp line 1348.

Could you try to do it ?

Ryu


> Dear all,
>
> Under the environment with GCC4.8.5 and ROOT6.08.04,
> we get the following warning messages when compiling XXXAnalyzer3, XXXAnalyzer4,
> XXXConfig, XXXConfig2,3,4, XXXDBAccess, and XXXConfigToForm.
>
>
> In file included from /usr/include/stdlib.h:24:0,
>                  from /meg/data1/shared/mc/benchmark_test/rome3-root6.08.04-
> gcc485/include/ROMEAnalyzer.h:10,
>                  from include/generated/MEGPrecompile.h:23,
>                  from <command-line>:0:
> /usr/include/features.h:330:4: warning: #warning _FORTIFY_SOURCE requires compiling
> with optimization (-O) [-Wcpp]
>  #  warning _FORTIFY_SOURCE requires compiling with optimization (-O)
>     ^
> [345/369] compiling obj/MEGAnalyzer4.o
> In file included from /usr/include/stdlib.h:24:0,
>                  from /meg/data1/shared/mc/benchmark_test/rome3-root6.08.04-
> gcc485/include/ROMEAnalyzer.h:10,
>                  from include/generated/MEGPrecompile.h:23,
>                  from <command-line>:0:
> /usr/include/features.h:330:4: warning: #warning _FORTIFY_SOURCE requires compiling
> with optimization (-O) [-Wcpp]
>  #  warning _FORTIFY_SOURCE requires compiling with optimization (-O)
>     ^
>
> It seems due to 'NOOPT' flag added to those objects in the Makefile.
> Is the 'NOOPT' flag necessary? If not, how can we remove it?
>
> Regards,
> Yusuke |
|
29 Nov 2017, Yusuke Uchiyama, Info, Compiler warning
|
Hi Ryu,

Thank you.
You are right. We add -D_FORTIFY_SOURCE=2 in CFLAGS and CXXFLAGS in our project Makefile.
If we remove it, the warnings go away.

I tried your suggestion but I got the following warning:

[346/369] compiling obj/MEGAnalyzer3.o
<command-line>:0:0: warning: "_FORTIFY_SOURCE" redefined [enabled by default]
<command-line>:0:0: note: this is the location of the previous definition

However, if I add
'-U_FORTIFY_SOURCE' instead the warning above disappears.

Do you think it is OK for all?

Regards,
Yusuke

> Hi Yusuke
>
> NOOPT is added for potentially large source files to reduce the compile time and memory usage.
>
> I guess -D_FORTIFY_SOURCE option is added in your project Makefile or in your environment variable, instead of by
> ROME.
> However, we could modify ROME to explicitly disable it by adding -D_FORTIFY_SOURCE=0 to NOOPT.
> That can be done by modifying builder/src/ROMEBuildMakeFile.cpp line 1348.
>
> Could you try to do it ?
>
> Ryu
>
>
> > Dear all,
> >
> > Under the environment with GCC4.8.5 and ROOT6.08.04,
> > we get the following warning messages when compiling XXXAnalyzer3, XXXAnalyzer4,
> > XXXConfig, XXXConfig2,3,4, XXXDBAccess, and XXXConfigToForm.
> >
> >
> > In file included from /usr/include/stdlib.h:24:0,
> >                  from /meg/data1/shared/mc/benchmark_test/rome3-root6.08.04-
> > gcc485/include/ROMEAnalyzer.h:10,
> >                  from include/generated/MEGPrecompile.h:23,
> >                  from <command-line>:0:
> > /usr/include/features.h:330:4: warning: #warning _FORTIFY_SOURCE requires compiling
> > with optimization (-O) [-Wcpp]
> >  #  warning _FORTIFY_SOURCE requires compiling with optimization (-O)
> >     ^
> > [345/369] compiling obj/MEGAnalyzer4.o
> > In file included from /usr/include/stdlib.h:24:0,
> >                  from /meg/data1/shared/mc/benchmark_test/rome3-root6.08.04-
> > gcc485/include/ROMEAnalyzer.h:10,
> >                  from include/generated/MEGPrecompile.h:23,
> >                  from <command-line>:0:
> > /usr/include/features.h:330:4: warning: #warning _FORTIFY_SOURCE requires compiling
> > with optimization (-O) [-Wcpp]
> >  #  warning _FORTIFY_SOURCE requires compiling with optimization (-O)
> >     ^
> >
> > It seems due to 'NOOPT' flag added to those objects in the Makefile.
> > Is the 'NOOPT' flag necessary? If not, how can we remove it?
> >
> > Regards,
> > Yusuke |
|
29 Nov 2017, Ryu Sawada, Info, Compiler warning
|
Hi.

Thank you for testing.

-U_FORTIFY_SOURCE is fine, and can be implemented in ROME.

Ryu

> Hi Ryu,
>
> Thank you.
> You are right. We add -D_FORTIFY_SOURCE=2 in CFLAGS and CXXFLAGS in our project Makefile.
> If we remove it, the warnings go away.
>
> I tried your suggestion but I got the following warning:
>
> [346/369] compiling obj/MEGAnalyzer3.o
> <command-line>:0:0: warning: "_FORTIFY_SOURCE" redefined [enabled by default]
> <command-line>:0:0: note: this is the location of the previous definition
>
> However, if I add
> '-U_FORTIFY_SOURCE' instead the warning above disappears.
>
> Do you think it is OK for all?
>
> Regards,
> Yusuke
>
> > Hi Yusuke
> >
> > NOOPT is added for potentially large source files to reduce the compile time and memory usage.
> >
> > I guess -D_FORTIFY_SOURCE option is added in your project Makefile or in your environment variable, instead of by
> > ROME.
> > However, we could modify ROME to explicitly disable it by adding -D_FORTIFY_SOURCE=0 to NOOPT.
> > That can be done by modifying builder/src/ROMEBuildMakeFile.cpp line 1348.
> >
> > Could you try to do it ?
> >
> > Ryu
> >
> >
> > > Dear all,
> > >
> > > Under the environment with GCC4.8.5 and ROOT6.08.04,
> > > we get the following warning messages when compiling XXXAnalyzer3, XXXAnalyzer4,
> > > XXXConfig, XXXConfig2,3,4, XXXDBAccess, and XXXConfigToForm.
> > >
> > >
> > > In file included from /usr/include/stdlib.h:24:0,
> > >                  from /meg/data1/shared/mc/benchmark_test/rome3-root6.08.04-
> > > gcc485/include/ROMEAnalyzer.h:10,
> > >                  from include/generated/MEGPrecompile.h:23,
> > >                  from <command-line>:0:
> > > /usr/include/features.h:330:4: warning: #warning _FORTIFY_SOURCE requires compiling
> > > with optimization (-O) [-Wcpp]
> > >  #  warning _FORTIFY_SOURCE requires compiling with optimization (-O)
> > >     ^
> > > [345/369] compiling obj/MEGAnalyzer4.o
> > > In file included from /usr/include/stdlib.h:24:0,
> > >                  from /meg/data1/shared/mc/benchmark_test/rome3-root6.08.04-
> > > gcc485/include/ROMEAnalyzer.h:10,
> > >                  from include/generated/MEGPrecompile.h:23,
> > >                  from <command-line>:0:
> > > /usr/include/features.h:330:4: warning: #warning _FORTIFY_SOURCE requires compiling
> > > with optimization (-O) [-Wcpp]
> > >  #  warning _FORTIFY_SOURCE requires compiling with optimization (-O)
> > >     ^
> > >
> > > It seems due to 'NOOPT' flag added to those objects in the Makefile.
> > > Is the 'NOOPT' flag necessary? If not, how can we remove it?
> > >
> > > Regards,
> > > Yusuke |
|
06 May 2016, SUDESHNA GANGULY, Info, Can we reset histograms at the middle of a run in ROME?
|
Hi All,

Suppose I want to pause a run, at the middle, and change some run conditions. So
I want to clear histograms at the middle of a run. Is that possible to do in ROME?

That when I pause the run, I want to clear histograms. So with the new run
conditions, when we resume that run, we will get clear pads and histograms will
be filled in new.


Thanks a lot!
Sudeshna |
11 May 2016, Ryu Sawada, Info, Can we reset histograms at the middle of a run in ROME? 
|
Dear Sudeshna,
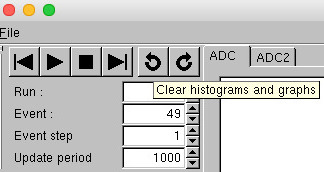
I added a new button to clear histograms.
Please update your ROME and use the 'develop' branch.
Best regards,
Ryu
> Hi All,
>
> Suppose I want to pause a run, at the middle, and change some run conditions. So
> I want to clear histograms at the middle of a run. Is that possible to do in ROME?
>
> That when I pause the run, I want to clear histograms. So with the new run
> conditions, when we resume that run, we will get clear pads and histograms will
> be filled in new.
>
>
> Thanks a lot!
> Sudeshna |
|
18 Apr 2016, SUDESHNA GANGULY, Info, Clear histogram/group of histograms at the beginning of run in ROME
|
Hi All,

Is there any way in ROME that I can clear histograms at:

    1)Run start.
    2) Clear by group (tab) ?


Thanks a lot!
Sudeshna |
|
21 Apr 2016, Ryu Sawada, Info, Clear histogram/group of histograms at the beginning of run in ROME
|
Dear Sudeshna,
In ROME, histograms are associated with a task (not with a tab).
Histograms are reset at the beginning of runs when "HistAccumulate" is false.
You can set it in your configuration XML like,
          <Histogram>
            <HistName>MyHisto</HistName>
            <HistAccumulate>false</HistAccumulate>
          </Histogram>
If you want to clear by hand, you can use ResetHisto() function of your tasks; the function is automatically implemented by ROMEbuilder.
Ryu
> Hi All,
>
> Is there any way in ROME that I can clear histograms at:
>
> 1)Run start.
> 2) Clear by group (tab) ?
>
>
> Thanks a lot!
> Sudeshna |
|
13 Apr 2016, SUDESHNA GANGULY, Bug Report, Error with maximum number of tabs in Argus section
|
Hi Ryu,

I am trying to use <Argus> for tabbing like this:
  <Argus>
          <Tab>
            <TabName>Tab1</TabName>
            <ObjectArrayIndex>0</ObjectArrayIndex>

            <Index>0</Index>
 </Tab>
   <Tab>
            <TabName>Tab1</TabName>
            <ObjectArrayIndex>1</ObjectArrayIndex>
            <Index>1</Index>
          </Tab>
   <Tab>
            <TabName>Tab1</TabName>
            <ObjectArrayIndex>2</ObjectArrayIndex>

            <Index>2</Index>
          </Tab>


And I need to add 18 tabs with each tab having three pads.
Now I when ever I cross Tab6 with three pads on it, it gives me this error:

[sganguly@g2be1 rometest]$ /home/sganguly/dqm/rome/bin/romebuilder.exe -i
midas.xml -midas
Maximal number of Tabs in the Argus section of Histogram 'h1_wf' reached : 20 !

I have noticed that currently I can define 6 tabs and 5 pads on each tab maximum.

Could you please help me with this?

Thanks a lot!
Sudeshna |
|
14 Apr 2016, SUDESHNA GANGULY, Info, Error with maximum number of tabs in Argus section
|
I've fixed the problem of not being able to define 18 tabs. I edited
/argus/include/ArgusHistoDisplay.h file:
I changed the parameter values to:

class ArgusHistoDisplay : public ArgusTab
{
protected:
   enum {
      kMaxNumberOfPads = 360,
      kMaxNumberOfPadsX = 10,
      kMaxNumberOfPadsY = 20,
      kNumberOfDisplayViewSelections0 = 54,
      kNumberOfDisplayViewSelections1 = 10,
      kNumberOfDisplayViewSelections2 = 10,
      kMaxNumberOfLines = 81
   };

Now I can define 18 tabs with 3 pads in each.


> Hi Ryu,
>
> I am trying to use <Argus> for tabbing like this:
>   <Argus>
>           <Tab>
>             <TabName>Tab1</TabName>
>             <ObjectArrayIndex>0</ObjectArrayIndex>
>
>             <Index>0</Index>
>  </Tab>
>    <Tab>
>             <TabName>Tab1</TabName>
>             <ObjectArrayIndex>1</ObjectArrayIndex>
>             <Index>1</Index>
>           </Tab>
>    <Tab>
>             <TabName>Tab1</TabName>
>             <ObjectArrayIndex>2</ObjectArrayIndex>
>
>             <Index>2</Index>
>           </Tab>
>
>
>
>
> And I need to add 18 tabs with each tab having three pads.
> Now I when ever I cross Tab6 with three pads on it, it gives me this error:
>
> [sganguly@g2be1 rometest]$ /home/sganguly/dqm/rome/bin/romebuilder.exe -i
> midas.xml -midas
> Maximal number of Tabs in the Argus section of Histogram 'h1_wf' reached : 20 !
>
> I have noticed that currently I can define 6 tabs and 5 pads on each tab maximum.
>
> Could you please help me with this?
>
> Thanks a lot!
> Sudeshna |
|
15 Apr 2016, Ryu Sawada, Info, Error with maximum number of tabs in Argus section
|
Dear Sudeshna

I commit the change to the 'develop' branch.

Ryu

> I've fixed the problem of not being able to define 18 tabs. I edited
> /argus/include/ArgusHistoDisplay.h file:
> I changed the parameter values to:
>
> class ArgusHistoDisplay : public ArgusTab
> {
> protected:
>    enum {
>       kMaxNumberOfPads = 360,
>       kMaxNumberOfPadsX = 10,
>       kMaxNumberOfPadsY = 20,
>       kNumberOfDisplayViewSelections0 = 54,
>       kNumberOfDisplayViewSelections1 = 10,
>       kNumberOfDisplayViewSelections2 = 10,
>       kMaxNumberOfLines = 81
>    };
>
> Now I can define 18 tabs with 3 pads in each.
>
>
>
>
> > Hi Ryu,
> >
> > I am trying to use <Argus> for tabbing like this:
> >   <Argus>
> >           <Tab>
> >             <TabName>Tab1</TabName>
> >             <ObjectArrayIndex>0</ObjectArrayIndex>
> >
> >             <Index>0</Index>
> >  </Tab>
> >    <Tab>
> >             <TabName>Tab1</TabName>
> >             <ObjectArrayIndex>1</ObjectArrayIndex>
> >             <Index>1</Index>
> >           </Tab>
> >    <Tab>
> >             <TabName>Tab1</TabName>
> >             <ObjectArrayIndex>2</ObjectArrayIndex>
> >
> >             <Index>2</Index>
> >           </Tab>
> >
> >
> >
> >
> > And I need to add 18 tabs with each tab having three pads.
> > Now I when ever I cross Tab6 with three pads on it, it gives me this error:
> >
> > [sganguly@g2be1 rometest]$ /home/sganguly/dqm/rome/bin/romebuilder.exe -i
> > midas.xml -midas
> > Maximal number of Tabs in the Argus section of Histogram 'h1_wf' reached : 20 !
> >
> > I have noticed that currently I can define 6 tabs and 5 pads on each tab maximum.
> >
> > Could you please help me with this?
> >
> > Thanks a lot!
> > Sudeshna |
|
14 Apr 2016, SUDESHNA GANGULY, Info, Is auto-update available for tabs with user-defined codes (not with <Argus>) ?
|
Is it possible to have the pads automatically updated with the update frequency
(set at romeConfig.xml) while using user-defined src/tabs codes?
Suppose I write a tab code under src/tabs where I have created an "update" button.
Now on the Argus display monitor, if I click on the "update" button, the display
will be updated. But what I've noticed is that clicking on the update button
introduces a delay. By the time the display is actually updated I've missed some
events already.

Is there any way to sync the update button with the update frequency in the
romeConfig.xml? So that it keeps up with every event?

I would really appreciate if anyone have any suggestion for this situation.

Thanks a lot!
Sudeshna |
|
15 Apr 2016, Ryu Sawada, Info, Is auto-update available for tabs with user-defined codes (not with <Argus>) ?
|
Dear Sudeshna

The easiest way would be to call your "Update" function from EventHandler function of your tabs.

You may or may not have a function named "Update", but I believe you must have a function to update your graphics
when your "Update" button is clicked.
You can call the same thing from EventHandler function, then it will keep the display updated.

If you want to control the frequency of the update of each tab, you can see two examples,
  $ROMESYS/examples/argus/thread/
  $ROMESYS/examples/argus/timer/
The examples update the display with using different tools (making other update thread or by using TTimer of ROOT).

Ryu

> Is it possible to have the pads automatically updated with the update frequency
> (set at romeConfig.xml) while using user-defined src/tabs codes?
> Suppose I write a tab code under src/tabs where I have created an "update" button.
> Now on the Argus display monitor, if I click on the "update" button, the display
> will be updated. But what I've noticed is that clicking on the update button
> introduces a delay. By the time the display is actually updated I've missed some
> events already.
>
> Is there any way to sync the update button with the update frequency in the
> romeConfig.xml? So that it keeps up with every event?
>
> I would really appreciate if anyone have any suggestion for this situation.
>
> Thanks a lot!
> Sudeshna |
|
11 Apr 2016, SUDESHNA GANGULY, Info, Getting an error while compiling a code with <ARGUS> tabs for 2-D histograms
|
Hi Ryu,
I am trying to display a 2-D histogram with the <Argus> tab in the user xml file.
Here is what I have in the xml:
<Histogram>
<HistName>h2_Exy</HistName>
<HistFolderName>CT</HistFolderName>
<HistArraySize>2</HistArraySize>
<HistType>TH2F</HistType>
<HistXLabel>xseg</HistXLabel>
<HistYLabel>yseg</HistYLabel>
<HistXNbins>9</HistXNbins>
<HistXmin>0.5</HistXmin>
<HistXmax>9.5</HistXmax>
<HistYNbins>6</HistYNbins>
<HistYmin>0.5</HistYmin>
<HistYmax>6.5</HistYmax>
<Argus>
<Tab>
<TabName>Summary</TabName>
<ObjectArrayIndex>0</ObjectArrayIndex>
<Index>0</Index>
</Tab>
</Argus>
</Histogram>
But when I compile the code it throws the following error message:
src/generated/HGUITSummary_Base.cpp:87: error: cannot convert �TH1F*� to �TH2F*�
in assignment
I am getting this error when ever I am trying to display 2-D histograms with
<Argus> tabs.
Any help will be much appreciated.
Sudeshna |
|
05 Apr 2016, SUDESHNA GANGULY, Bug Report, Running ROME remotely
|
Hi Ryu,

After following your instructions to run ROME remotely, using run mode 3 on the
client machine, and mode 0 on the server machine, we can see ARGUS display
appearing on the client machine.
But that does not work if we have the <ARGUS> block for tabbing in the user xml
file. I see a bunch of error messages and then ROME crashes on the client machine.
There might be some conflict with using ARGUS and using run mode 3?

If I take off the <ARGUS> tab block and write my own src/tabs/tab codes, then on
my client machine, using run mode 3 works, the display appears with histograms
without a crash.

Any thought on this issue will be much appreciated.

Thanks,
Sudeshna |
|
08 Apr 2016, Ryu Sawada, Bug Report, Running ROME remotely
|
Dear Sudeshna

I modified ROME to try to fix problems related <ARGUS> block histograms in run-mode 3.
Could you please pull ROME and use the 'develop' branch ?
(You can switch branches with "git checkout develop' command)

There is an example, examples/argus/histogram.
I tested with the example and it works.

'romeproject' in the directory works as a server.

What you need to use the example for the test is,
0) 'make' in $ROMESYS
1) Build and compile both  examples/argus/histogram and  examples/argus/histogram/romeproject
2) Start analyzer in romeproject with using romeConfig.xml
3) Start monitor with using argusConfig.xml

In the second tab, you must see an <ARGUS> block histogram updated periodically.

Ryu


> Hi Ryu,
>
> After following your instructions to run ROME remotely, using run mode 3 on the
> client machine, and mode 0 on the server machine, we can see ARGUS display
> appearing on the client machine.
> But that does not work if we have the <ARGUS> block for tabbing in the user xml
> file. I see a bunch of error messages and then ROME crashes on the client machine.
> There might be some conflict with using ARGUS and using run mode 3?
>
> If I take off the <ARGUS> tab block and write my own src/tabs/tab codes, then on
> my client machine, using run mode 3 works, the display appears with histograms
> without a crash.
>
> Any thought on this issue will be much appreciated.
>
> Thanks,
> Sudeshna |
|
23 Mar 2016, Farrukh Azfar, Info, ROME in online mode using an intermediary machine
|
Dear Folks

Complete newby on online mode - hence this easy question :

I have three machines, A, B, and C.

A is where a MIDAS EventBuilder is running
B is a gateway machine
C is my local machine on which I want to run ROME analyser (in online mode)

A is not accessible from C. B is accesible from both A and C -

I want to utilize the fact that I have a gateway to run ROME analyser in online
mode reading data from A via B -

If someone could explain how to do this in detail - but in simple terms - I'd be
grateful

Thank you !

Farrukh |
|
27 Mar 2016, Ryu Sawada, Info, ROME in online mode using an intermediary machine
|
Hello,
I think you need to use SSH port forwarding,
On C, you open a terminal and type a command like, ssh -L 21175:A:1175 B 1175 is the MIDAS server port number.
For avoiding the connection being terminated, you may better to type a command to keep the communication, for
example, top
Then, on C, you configure ROME to connect to localhost and port number is 21175, and start the ROME analyzer.
Ryu
> Dear Folks
>
> Complete newby on online mode - hence this easy question :
>
> I have three machines, A, B, and C.
>
> A is where a MIDAS EventBuilder is running
> B is a gateway machine
> C is my local machine on which I want to run ROME analyser (in online mode)
>
> A is not accessible from C. B is accesible from both A and C -
>
> I want to utilize the fact that I have a gateway to run ROME analyser in online
> mode reading data from A via B -
>
> If someone could explain how to do this in detail - but in simple terms - I'd be
> grateful
>
> Thank you !
>
> Farrukh |
|
30 Mar 2016, Farrukh Azfar, Info, ROME in online mode using an intermediary machine
|
Hi Ryu
Thanks for your reply
so we did do that - it seems that the path to MIDASYS needs to be defined on the localhost too ? Anyhow the program does not run complaining that it is unable to read from the online database -
[HGUIExample,ERROR] [ROMEPrint.cpp:177:ROMEPrint::Error,ERROR] Can not read run status from the online database
So the ODB cannot be read through this port ? Do you have an example of running ROME through an ssh tunnel via an intermediary (gateway) machine ?
many thanks
Farrukh
| Ryu Sawada wrote: | Hello,
I think you need to use SSH port forwarding,
On C, you open a terminal and type a command like, ssh -L 21175:A:1175 B 1175 is the MIDAS server port number.
For avoiding the connection being terminated, you may better to type a command to keep the communication, for
example, top
Then, on C, you configure ROME to connect to localhost and port number is 21175, and start the ROME analyzer.
Ryu
> Dear Folks
>
> Complete newby on online mode - hence this easy question :
>
> I have three machines, A, B, and C.
>
> A is where a MIDAS EventBuilder is running
> B is a gateway machine
> C is my local machine on which I want to run ROME analyser (in online mode)
>
> A is not accessible from C. B is accesible from both A and C -
>
> I want to utilize the fact that I have a gateway to run ROME analyser in online
> mode reading data from A via B -
>
> If someone could explain how to do this in detail - but in simple terms - I'd be
> grateful
>
> Thank you !
>
> Farrukh |
|
|
31 Mar 2016, Ryu Sawada, Info, ROME in online mode using an intermediary machine
|
The local port 21175 may be too large, please replace 21175 by, for example, 8175.
You can specify the host name and the port number in your config XML for your ROME program like, <Online>
<Host>localhost:8175</Host>
</Online>
Can you connect the MIDAS experiment from the host B with using other midas applications, e.g odbedit ?
Can you try odbedit -h A -e EXP (replace EXP with your experiment name)
If you can not connect, I think there is a problem which is not related to ROME.
Can you also check if you can connect the MIDAS experiment from the host C with using other midas applications, e.g odbedit, after establishing the SSH tunnel ?
Can you try odbedit -h localhost:8175 -e EXP (replace EXP with your experiment name)
Ryu
| Farrukh Azfar wrote: | Hi Ryu
Thanks for your reply
so we did do that - it seems that the path to MIDASYS needs to be defined on the localhost too ? Anyhow the program does not run complaining that it is unable to read from the online database -
[HGUIExample,ERROR] [ROMEPrint.cpp:177:ROMEPrint::Error,ERROR] Can not read run status from the online database
So the ODB cannot be read through this port ? Do you have an example of running ROME through an ssh tunnel via an intermediary (gateway) machine ?
many thanks
Farrukh
| Ryu Sawada wrote: | Hello,
I think you need to use SSH port forwarding,
On C, you open a terminal and type a command like, ssh -L 21175:A:1175 B 1175 is the MIDAS server port number.
For avoiding the connection being terminated, you may better to type a command to keep the communication, for
example, top
Then, on C, you configure ROME to connect to localhost and port number is 21175, and start the ROME analyzer.
Ryu
> Dear Folks
>
> Complete newby on online mode - hence this easy question :
>
> I have three machines, A, B, and C.
>
> A is where a MIDAS EventBuilder is running
> B is a gateway machine
> C is my local machine on which I want to run ROME analyser (in online mode)
>
> A is not accessible from C. B is accesible from both A and C -
>
> I want to utilize the fact that I have a gateway to run ROME analyser in online
> mode reading data from A via B -
>
> If someone could explain how to do this in detail - but in simple terms - I'd be
> grateful
>
> Thank you !
>
> Farrukh |
|
|
|
04 Apr 2016, Wes Gohn, Info, ROME in online mode using an intermediary machine
|
Hi Ryu, here is the method we've followed. I tried to simplify things by connecting to the server directly, so we can skip the port tunnelling. On the server side, in the romeConfig.xml, I set
<SocketServer>
<Active>true</Active>
<PortNumber>9091</PortNumber>
</SocketServer>
I then started rome in batch mode
./midanalyzer.exe -i romeConfig.xml -b
It connects to a running experiment as expected, and is processing data.
On the client machine, I set in romeConfig.xml:
<SocketClient>
<Host>myhost</Host>
<Port>9091</Port>
</SocketClient>
I then start rome using the -R option:
./midanalyzer.exe -R myhost:9091
*****************************************
* *
* MIDAnalyzer *
* *
* generated by the ROME Environment *
* Version 3.2.6 *
* *
*****************************************
Remote session to myhost:9091
midanalyzer [0]
At which point it does establish the socket connection to the server side, but it just sits there (I can establish this because if I run commands at the prompt, I see some errors pop up on my server terminal). How do I open my Argus browser on the client side to see the plots?
Or is there something we're doing that is fundamentally wrong?
Thanks,
Wes |
|
05 Apr 2016, Ryu Sawada, Info, ROME in online mode using an intermediary machine
|
Dear Wes,
-R is used for starting an interactive session connected to a server.
If you want to see Argus windows, please change <ProgramMode> to 3 (or use "-p 3" comman-line option).
Ryu
| Wes Gohn wrote: |
Hi Ryu, here is the method we've followed. I tried to simplify things by connecting to the server directly, so we can skip the port tunnelling. On the server side, in the romeConfig.xml, I set
<SocketServer>
<Active>true</Active>
<PortNumber>9091</PortNumber>
</SocketServer>
I then started rome in batch mode
./midanalyzer.exe -i romeConfig.xml -b
It connects to a running experiment as expected, and is processing data.
On the client machine, I set in romeConfig.xml:
<SocketClient>
<Host>myhost</Host>
<Port>9091</Port>
</SocketClient>
I then start rome using the -R option:
./midanalyzer.exe -R myhost:9091
*****************************************
* *
* MIDAnalyzer *
* *
* generated by the ROME Environment *
* Version 3.2.6 *
* *
*****************************************
Remote session to myhost:9091
midanalyzer [0]
At which point it does establish the socket connection to the server side, but it just sits there (I can establish this because if I run commands at the prompt, I see some errors pop up on my server terminal). How do I open my Argus browser on the client side to see the plots?
Or is there something we're doing that is fundamentally wrong?
Thanks,
Wes |
|
|
21 Mar 2016, Farrukh Azfar, Info, speeding up ROME
|
|
|
10 Mar 2016, Farrukh Azfar, Forum, Option to analyse every Nth event
|
Dear Colleagues

I was wondering if there was an option to analyse only ever N events in ROME. If
this is doable via an xml switch I am guessing this would be the best and most
convenient solution.

Else any advice on how to do this in code would be great as well -

many thanks
Farrukh |
|
13 Mar 2016, Ryu Sawada, Forum, Option to analyse every Nth event
|
I added a new parameter <EventStep> to configuration XML file.
The default is 1.
If you change it to, for example 2, every second events are analyzed.

For using it, you need to
- update ROME
- compile ROME
- re-build and make your project

Once you use an existing config XML file, a new parameter will be automatically added to it.

Ryu

> Dear Colleagues
>
> I was wondering if there was an option to analyse only ever N events in ROME. If
> this is doable via an xml switch I am guessing this would be the best and most
> convenient solution.
>
> Else any advice on how to do this in code would be great as well -
>
> many thanks
> Farrukh |
|
07 Mar 2016, SUDESHNA GANGULY, Suggestion, Problem in adding two TGraphs in the same pad using <Argus> block in tabbing
|
I wanted to add two different TGraphs (Corresponding to two calorimeters) into
the same pad.
So in the xml file I did:
<Graph>
  <GraphName>MyGraph</GraphName>
  <GraphFolderName>mygraphs</GraphFolderName>
  <GraphType>TGraph</GraphType>
<GraphArraySize>2</GraphArraySize>
  <GraphXLabel>Event no.</GraphXLabel>
  <GraphYLabel>Island no.</GraphYLabel>
  <GraphXmin>0</GraphXmin>
  <GraphXmax>10000</GraphXmax>
  <GraphYmin>0</GraphYmin>
  <GraphYmax>100000</GraphYmax>
 <Argus>
<Tab>
      <TabName>SummaryFCBank</TabName>
    <ObjectArrayIndex>0-1</ObjectArrayIndex>
      <Index>1</Index>
 <DrawSamePad>true</DrawSamePad>
    </Tab>
  </Argus>
</Graph>


And in src/tasks:
in the HGUITFillHisto.cpp code I did:
 for(int icalo=1; icalo<3; icalo++)   [For each calorimeter there is one bank, and one n_islands value from that
bank per event.]
    {
GetMyGraphAt(icalo-1)->SetPoint(gAnalyzer->GetCurrentEventNumber(),gAnalyzer->GetCurrentEventNumber(),n_islands);

 GetMyGraphAt(0)->SetMarkerColor(2);

 GetMyGraphAt(1)->SetMarkerColor(3);

 ArgusHistoDisplay::SetLimits(GetMyGraphAt(icalo-1));

}

But then I get an empty pad in the tab.
It works when I create the TGraph for only one calorimeter, using GetMyGraph().

Any help would be much appreciated.

Thanks!
Sudeshna |
|
13 Mar 2016, Ryu Sawada, Suggestion, Problem in adding two TGraphs in the same pad using <Argus> block in tabbing
|
I tried to reproduce the problem with using histoGUI example.
However I couldn't reproduce it; namely two graphs are shown.
I attached a modification for the example, which I applied for the test.
If you attach something similar which can reproduce the problem, it will be easier for me to find the reason.
Ryu
diff --git a/examples/histoGUI/histoGUI.xml b/examples/histoGUI/histoGUI.xml
index 3043dec..489052a 100644
--- a/examples/histoGUI/histoGUI.xml
+++ b/examples/histoGUI/histoGUI.xml
@@ -34,6 +34,7 @@
 				<GraphName>MyGraph</GraphName>
 				<GraphFolderName>mygraphs</GraphFolderName>
 				<GraphType>TGraph</GraphType>
+				<GraphArraySize>2</GraphArraySize>
 				<GraphXLabel>X</GraphXLabel>
 				<GraphYLabel>Y</GraphYLabel>
 				<GraphXmin>0</GraphXmin>
@@ -43,7 +44,9 @@
 				<Argus>
 					<Tab>
 						<TabName>GeneratedHisto</TabName>
+						<ObjectArrayIndex>0-1</ObjectArrayIndex>
 						<Index>4</Index>
+						<DrawSamePad>true</DrawSamePad>
 					</Tab>
 				</Argus>
 			</Graph>
diff --git a/examples/histoGUI/src/tasks/HGUITFillHisto.cpp b/examples/histoGUI/src/tasks/HGUITFillHisto.cpp
index 6ada840..c4dd95f 100644
--- a/examples/histoGUI/src/tasks/HGUITFillHisto.cpp
+++ b/examples/histoGUI/src/tasks/HGUITFillHisto.cpp
@@ -51,7 +51,10 @@ ClassImp(HGUITFillHisto)

 void HGUITFillHisto::Init()
 {
-   GetMyGraph()->SetMarkerStyle(31);
+   GetMyGraphAt(0)->SetMarkerStyle(31);
+   GetMyGraphAt(1)->SetMarkerStyle(31);
+   GetMyGraphAt(0)->SetMarkerColor(2);
+   GetMyGraphAt(1)->SetMarkerColor(4);
    GetMyGraphError()->SetMarkerStyle(8);
    GetMyGraphError()->SetMarkerColor(4);
 }
@@ -69,17 +72,23 @@ void HGUITFillHisto::Event()
    GetMyHistoAt(2)->SetLineColor(2);
    GetMyHistoAt(3)->SetLineColor(4);
    GetMyOtherHisto()->Fill(gRandom->Gaus(0,40));
-   GetMyGraph()->SetPoint(0,0,gRandom->Rndm());
-   GetMyGraph()->SetPoint(1,1,gRandom->Rndm());
-   GetMyGraph()->SetPoint(2,2,gRandom->Rndm());
-   GetMyGraph()->SetPoint(3,3,gRandom->Rndm());
-   GetMyGraph()->SetPoint(4,4,gRandom->Rndm());
+   GetMyGraphAt(0)->SetPoint(0,0,gRandom->Rndm());
+   GetMyGraphAt(0)->SetPoint(1,1,gRandom->Rndm());
+   GetMyGraphAt(0)->SetPoint(2,2,gRandom->Rndm());
+   GetMyGraphAt(0)->SetPoint(3,3,gRandom->Rndm());
+   GetMyGraphAt(0)->SetPoint(4,4,gRandom->Rndm());
+   GetMyGraphAt(1)->SetPoint(0,0,gRandom->Rndm());
+   GetMyGraphAt(1)->SetPoint(1,1,gRandom->Rndm());
+   GetMyGraphAt(1)->SetPoint(2,2,gRandom->Rndm());
+   GetMyGraphAt(1)->SetPoint(3,3,gRandom->Rndm());
+   GetMyGraphAt(1)->SetPoint(4,4,gRandom->Rndm());
    GetMyGraphError()->SetPoint(0,0,gRandom->Rndm());
    GetMyGraphError()->SetPoint(1,1,gRandom->Rndm());
    GetMyGraphError()->SetPoint(2,2,gRandom->Rndm());
    GetMyGraphError()->SetPoint(3,3,gRandom->Rndm());
    GetMyGraphError()->SetPoint(4,4,gRandom->Rndm());
-   ArgusHistoDisplay::SetLimits(GetMyGraph());
+   ArgusHistoDisplay::SetLimits(GetMyGraphAt(0));
+   ArgusHistoDisplay::SetLimits(GetMyGraphAt(1));
    ArgusHistoDisplay::SetLimits(GetMyGraphError());
 }
> I wanted to add two different TGraphs (Corresponding to two calorimeters) into
> the same pad.
> So in the xml file I did:
> <Graph>
> <GraphName>MyGraph</GraphName>
> <GraphFolderName>mygraphs</GraphFolderName>
> <GraphType>TGraph</GraphType>
> <GraphArraySize>2</GraphArraySize>
> <GraphXLabel>Event no.</GraphXLabel>
> <GraphYLabel>Island no.</GraphYLabel>
> <GraphXmin>0</GraphXmin>
> <GraphXmax>10000</GraphXmax>
> <GraphYmin>0</GraphYmin>
> <GraphYmax>100000</GraphYmax>
> <Argus>
> <Tab>
> <TabName>SummaryFCBank</TabName>
> <ObjectArrayIndex>0-1</ObjectArrayIndex>
> <Index>1</Index>
> <DrawSamePad>true</DrawSamePad>
> </Tab>
> </Argus>
> </Graph>
>
>
> And in src/tasks:
> in the HGUITFillHisto.cpp code I did:
> for(int icalo=1; icalo<3; icalo++) [For each calorimeter there is one bank, and one n_islands value from that
> bank per event.]
> {
> GetMyGraphAt(icalo-1)->SetPoint(gAnalyzer->GetCurrentEventNumber(),gAnalyzer->GetCurrentEventNumber(),n_islands);
>
> GetMyGraphAt(0)->SetMarkerColor(2);
>
> GetMyGraphAt(1)->SetMarkerColor(3);
>
> ArgusHistoDisplay::SetLimits(GetMyGraphAt(icalo-1));
>
> }
>
> But then I get an empty pad in the tab.
> It works when I create the TGraph for only one calorimeter, using GetMyGraph().
>
> Any help would be much appreciated.
>
> Thanks!
> Sudeshna |
|
18 Feb 2016, Joe Grange, Forum, Online mode issue
|
Hello all,

I'm having an issue with getting rome to run in online mode in some cases only.
 That is, when I run the analyzer that accesses the INPT bank (standard for PSI
slow control buses) the online mode works just fine.  But when I access other
banks, when I run in online mode only blank canvases are updated and no data
appears.

I can run all of these analyzers in offline mode and they all work as expected
so this eliminates many common user bugs.  Any ideas how I might debug further?
 I also tried printing the data in the various tasks and indeed in online mode
no data is being accessed.

Thanks,
Joe |
|
02 Mar 2016, Ryu Sawada, Forum, Online mode issue
|
Dear Joe

There is a working example for the online access to midas.

Please see,
https://bitbucket.org/muegamma/rome3/wiki/Midas
The example is $ROMESYS/examples/midas.
There is a README file in the directory.
The example works with an example experiment in MIDAS package so you can try.
If you look at ADC2 tab, the histograms should be updated when DAQ is running.

The "Trigger" events are polled in the MIDAS frontend, and "Scaler" data are taken periodically.
So I guess the "Scaler" corresponds to your INPT and "Trigger" corresponds to your other event types.

You may compare the examples and your analyzer/frontend for finding the cause of your problem.

Ryu

> Hello all,
>
> I'm having an issue with getting rome to run in online mode in some cases only.
>  That is, when I run the analyzer that accesses the INPT bank (standard for PSI
> slow control buses) the online mode works just fine.  But when I access other
> banks, when I run in online mode only blank canvases are updated and no data
> appears.
>
> I can run all of these analyzers in offline mode and they all work as expected
> so this eliminates many common user bugs.  Any ideas how I might debug further?
>  I also tried printing the data in the various tasks and indeed in online mode
> no data is being accessed.
>
> Thanks,
> Joe |
|
01 Mar 2016, SUDESHNA GANGULY, Info, Adding different tabs under a single parent tab
|
Hi Everyone,

Is there any way I can put different tabs under a single click-able menu in ROME?
Suppose I have tabs A, B, C, D. Each one of these tabs contains histograms. Can
I now, put A, B, C, D under another click-able menu called "calorimeters" ?

So that when I click on "calorimeters", I will see A, B, C, D. And then when I
click on A/B/C/D I will see the histograms.

Can that be done?
Is there any example available?

Thanks for any help!
Sudeshna |
|
02 Mar 2016, Ryu Sawada, Info, Adding different tabs under a single parent tab
|
Yes, it can be done easily by nesting the tab definition in your definition XML file.
An example is $ROMESYS/examples/argus/tabs

Ryu

> Hi Everyone,
>
> Is there any way I can put different tabs under a single click-able menu in ROME?
> Suppose I have tabs A, B, C, D. Each one of these tabs contains histograms. Can
> I now, put A, B, C, D under another click-able menu called "calorimeters" ?
>
> So that when I click on "calorimeters", I will see A, B, C, D. And then when I
> click on A/B/C/D I will see the histograms.
>
> Can that be done?
> Is there any example available?
>
> Thanks for any help!
> Sudeshna |
|
22 Jan 2016, SUDESHNA GANGULY, Suggestion, Adding texts on a histigram while using <Argus> block for tabbing
|
Hi,

I am defining a histogram in the xml file like this:

<Histogram>
  <HistName>h2_dt_tcpgotheader</HistName>
  <HistFolderName>BC</HistFolderName>
  <HistType>TH2D</HistType>
<HistXLabel>time(us)</HistXLabel>
  <HistYLabel>Entries</HistYLabel>
  <HistXNbins>300000</HistXNbins>
  <HistXmin>-20000</HistXmin>
  <HistXmax>100000</HistXmax>
  <HistYNbins>10</HistYNbins>
  <HistYmin>0.0</HistYmin>
  <HistYmax>10</HistYmax>-->
  <Argus>
    <Tab>
      <TabName>SummaryBCBank</TabName>
      <Index>0</Index>
    </Tab>
  </Argus>
</Histogram>

Now I want to add few texts and arrows on the same pad where the histogram is
being written.

I want to add this piece of code:

  TLatex title;
  title.SetTextFont(12);
  title.SetTextSize(0.03);
  title.SetNDC();


      title.SetTextColor(2);
      title.DrawLatex(0.01,0.32,"tcp header #rightarrow");
      title.SetTextColor(3);
      title.DrawLatex(0.01,0.4,"tcp data  #rightarrow");
      title.SetTextColor(4);
      title.DrawLatex(0.01,0.48,"copy to GPU #rightarrow");
      title.SetTextColor(5);
      title.DrawLatex(0.01,0.56,"GPU processing #rightarrow");
      title.SetTextColor(6);
      title.DrawLatex(0.01,0.64,"MFE start #rightarrow");
      title.SetTextColor(7);
      title.DrawLatex(0.01,0.72,"MFE stop #rightarrow");

The problem is that if I add this piece of code in the src/tasks, where I fill
in the histogram, then the problem is that this histogram replaces whatever is
on the last tab on the canvas.

As I recall that I am not supposed to add extra tabbing codes in the src codes
when I am using the <Argus> block for tabbing.

So where can I add these texts while still using <Argus> block for tabbing?

Any help might be very much appreciated. |
|
28 Jan 2016, Ryu Sawada, Suggestion, Adding texts on a histigram while using <Argus> block for tabbing
|
Dear Sudeshna

Unfortunately, with the current ROME, it is not possible to insert own code when you use <Argus> blocks for
which the source code is supposed to be generated automatically (and not editable).

If you want to do more than the automatically generated code, you can use the normal type tabs although you
need to program it by yourself (as you program tasks).

An example is $ROMESYS/examples/midas.
In midas.xml, you can find <Tabs> section where several normal tabs are defined.
Corresponding source files will be generated in src/tabs when you run romebuilder after modifying the
definition
XML.

As for source files of tasks, you can edit the source files of tabs as you want.
ROMEbuilder will not overwrite the files.
You can draw any ROOT GUI objects in the tabs including text.

You can get the pointer of histograms associated to a task.
For example, in the midas example, src/tabs/MIDTADCTab.cpp, a pointer of a histogram 'ADC' of
'FillHistogram'
task is obtained by
  gAnalyzer->GetFillHistogramTask()->GetADCAt(i)

Please let me know if you have any problems to write code for your tabs.

Best regards,

Ryu


> Hi,
>
> I am defining a histogram in the xml file like this:
>
> <Histogram>
>   <HistName>h2_dt_tcpgotheader</HistName>
>   <HistFolderName>BC</HistFolderName>
>   <HistType>TH2D</HistType>
> <HistXLabel>time(us)</HistXLabel>
>   <HistYLabel>Entries</HistYLabel>
>   <HistXNbins>300000</HistXNbins>
>   <HistXmin>-20000</HistXmin>
>   <HistXmax>100000</HistXmax>
>   <HistYNbins>10</HistYNbins>
>   <HistYmin>0.0</HistYmin>
>   <HistYmax>10</HistYmax>-->
>   <Argus>
>     <Tab>
>       <TabName>SummaryBCBank</TabName>
>       <Index>0</Index>
>     </Tab>
>   </Argus>
> </Histogram>
>
> Now I want to add few texts and arrows on the same pad where the histogram is
> being written.
>
> I want to add this piece of code:
>
>   TLatex title;
>   title.SetTextFont(12);
>   title.SetTextSize(0.03);
>   title.SetNDC();
>
>
>       title.SetTextColor(2);
>       title.DrawLatex(0.01,0.32,"tcp header #rightarrow");
>       title.SetTextColor(3);
>       title.DrawLatex(0.01,0.4,"tcp data  #rightarrow");
>       title.SetTextColor(4);
>       title.DrawLatex(0.01,0.48,"copy to GPU #rightarrow");
>       title.SetTextColor(5);
>       title.DrawLatex(0.01,0.56,"GPU processing #rightarrow");
>       title.SetTextColor(6);
>       title.DrawLatex(0.01,0.64,"MFE start #rightarrow");
>       title.SetTextColor(7);
>       title.DrawLatex(0.01,0.72,"MFE stop #rightarrow");
>
> The problem is that if I add this piece of code in the src/tasks, where I fill
> in the histogram, then the problem is that this histogram replaces whatever is
> on the last tab on the canvas.
>
> As I recall that I am not supposed to add extra tabbing codes in the src codes
> when I am using the <Argus> block for tabbing.
>
> So where can I add these texts while still using <Argus> block for tabbing?
>
> Any help might be very much appreciated. |
|
10 Dec 2015, SUDESHNA GANGULY, Suggestion, writing data to mySQL via ROME
|
I need some suggestions on how to write some data to a mySQL database via ROME.

I am calculating a quantity CTag and making a TGraph of CTag/event in ROME. Now
if I want to write it to a mySQL what shall I do?

From the manual I found that we can read from a database DAQ (SQL) system. That
it reads the main input data from a database. And I looked into the example
under'rome/examples/stepbystepdbdaq'.

But is there any way I can write the calculated CTags and Event Numbers to a SQL
database?

Thanks for any suggestion! |
|
11 Dec 2015, Ryu Sawada, Suggestion, writing data to mySQL via ROME
|
Dear Sudeshna

Yes, you can write,

There is an example project for showing the access to databases.
$ROMESYS/examples/dbexample/

For writing, an example is
$ROMESYS/examples/dbexample/src/tasks/RDBTWriteFolders.cpp

If you prefer to use normal SQL queries rather than using the ROME DB path. An example is,
$ROMESYS/examples/dbexample/src/tasks/RDBTMakeQuery.cpp
By using SQL query, you can do anything about DB.

More information is in wiki,
https://bitbucket.org/muegamma/rome3/wiki/Database

Best regards,

Ryu

> I need some suggestions on how to write some data to a mySQL database via ROME.
>
> I am calculating a quantity CTag and making a TGraph of CTag/event in ROME. Now
> if I want to write it to a mySQL what shall I do?
>
> From the manual I found that we can read from a database DAQ (SQL) system. That
> it reads the main input data from a database. And I looked into the example
> under'rome/examples/stepbystepdbdaq'.
>
> But is there any way I can write the calculated CTags and Event Numbers to a SQL
> database?
>
> Thanks for any suggestion! |
|
03 Dec 2015, SUDESHNA GANGULY, Suggestion, Drawing multiple histograms on the same pad and dispalying them in the online mode in ROME
|
I need some suggestions regarding drawing multiple histograms on the same pad in
ROME.
Here is what I have been doing.  I am making a summary histogram online dispaly
with ARGUS. The displays is gonna show multiple different types of histograms.

So I made a module with four different types of histograms all on the same canvas,
so that I can look at them in real time in an online run.

Now in one of the histograms, I am looping over multiple banks, so in one of the
pads, I want to see two different lines of different colors (to indicate two
different histograms of the same type from two banks).
So I used histoGUI.xml (from examples/histoGUI) and used this way of histogram
and tab declarations:
  <Tasks>
                <Task>
                        <TaskName>FillHisto</TaskName>
        <Histogram>
                                <HistName>h1_Esum</HistName>


                                <HistArraySize>2</HistArraySize>
                                <HistFolderName>myhistos</HistFolderName>
                                <HistType>TH1F</HistType>

                                <HistXLabel>ESum</HistXLabel>
                                <HistYLabel>Entries</HistYLabel>
                                <HistXNbins>300</HistXNbins>
                                <HistXmin>0</HistXmin>
                                <HistXmax>3.1</HistXmax>
</Histogram>


<Histogram>
                                <HistName>h1_amplitude</HistName>
                                <HistFolderName>myotherhistos</HistFolderName>
                                 <HistArraySize>108</HistArraySize>


                                <HistType>TH1F</HistType>
                                <HistXLabel>Amplitude</HistXLabel>
                                <HistYLabel>Entries</HistYLabel>
                                <HistXNbins>4096</HistXNbins>
                                <HistXmin>-0.5</HistXmin>
                                <HistXmax>4095.5</HistXmax>
                                <Argus>
                                        <Tab>
                                                <TabName>GeneratedHisto</TabName>

<ObjectArrayIndex>0</ObjectArrayIndex>

                                                <Index>1</Index>
                                        </Tab>
                                </Argus>
                        </Histogram>

etc. and two other histograms have been defined in the same way.

And then in the src/task: HGUITFillHisto.cpp
I added this: (to draw two histograms on the same pad)

          if(icalo==1)
            {
          Geth1_EsumAt(0)->Fill(0.00009118*sum);

          Geth1_EsumAt(0)->SetLineColor(3);

             }

          Geth1_EsumAt(0)->Draw();

          if(icalo==2)
            {
          Geth1_EsumAt(1)->Fill(0.00009118*sum);

            }

          Geth1_EsumAt(1)->Draw("same");

And attached is the screen shot from ARGUS.

Now the problem is: when I add the Draw() and Draw("same") codes in the src/task
code, it always creates two copies of the same pad. The 0th pad and the very last
pad. So what ever is on the last pad in the attachment is being replaced by the
same copy of the 0th pad. I kept chaning the Index number in histoGUI.xml, but what
ever I do, if I try to draw two histograms on the same pad and add those codes in
the srdc/task .cpp file, it always creates two copies.

I don't know where to look at to fix the problem.

Is there any other way I can add multiple histograms on a pad, while keeping the
other pads on the canvas intact?

Any help on this issue will be much appreciated. |
|
07 Dec 2015, Ryu Sawada, Suggestion, Drawing multiple histograms on the same pad and dispalying them in the online mode in ROME
|
Hello,

First of all, the histograms are supposed to be drawn by the automatically generated code.

You don't need (and should not) draw them from a task.
If you do so, the histograms are drawn on the active pad (gPad) which is, in your case, the last pad on a tab.


I added a new feature to ROME development branch.
For using the feature, you can try
 cd $ROMESYS
 git checkout develop
 git pull
 make
 cd your_project
 make build
 make

As you can see in the updated examples/histoGUI/histoGUI.xml, a new option <DrawSamePad>true</DrawSamePad> is
available.
When it is true, the array of histograms are drawn on the same pad.

If you have any problems, please let me know.

Best regards,

Ryu


> I need some suggestions regarding drawing multiple histograms on the same pad in
> ROME.
> Here is what I have been doing.  I am making a summary histogram online dispaly
> with ARGUS. The displays is gonna show multiple different types of histograms.
>
> So I made a module with four different types of histograms all on the same canvas,
> so that I can look at them in real time in an online run.
>
> Now in one of the histograms, I am looping over multiple banks, so in one of the
> pads, I want to see two different lines of different colors (to indicate two
> different histograms of the same type from two banks).
> So I used histoGUI.xml (from examples/histoGUI) and used this way of histogram
> and tab declarations:
>   <Tasks>
>                 <Task>
>                         <TaskName>FillHisto</TaskName>
>         <Histogram>
>                                 <HistName>h1_Esum</HistName>
>
>
>                                 <HistArraySize>2</HistArraySize>
>                                 <HistFolderName>myhistos</HistFolderName>
>                                 <HistType>TH1F</HistType>
>
>                                 <HistXLabel>ESum</HistXLabel>
>                                 <HistYLabel>Entries</HistYLabel>
>                                 <HistXNbins>300</HistXNbins>
>                                 <HistXmin>0</HistXmin>
>                                 <HistXmax>3.1</HistXmax>
> </Histogram>
>
>
>
>
> <Histogram>
>                                 <HistName>h1_amplitude</HistName>
>                                 <HistFolderName>myotherhistos</HistFolderName>
>                                  <HistArraySize>108</HistArraySize>
>
>
>                                 <HistType>TH1F</HistType>
>                                 <HistXLabel>Amplitude</HistXLabel>
>                                 <HistYLabel>Entries</HistYLabel>
>                                 <HistXNbins>4096</HistXNbins>
>                                 <HistXmin>-0.5</HistXmin>
>                                 <HistXmax>4095.5</HistXmax>
>                                 <Argus>
>                                         <Tab>
>                                                 <TabName>GeneratedHisto</TabName>
>
> <ObjectArrayIndex>0</ObjectArrayIndex>
>
>                                                 <Index>1</Index>
>                                         </Tab>
>                                 </Argus>
>                         </Histogram>
>
> etc. and two other histograms have been defined in the same way.
>
> And then in the src/task: HGUITFillHisto.cpp
> I added this: (to draw two histograms on the same pad)
>
>           if(icalo==1)
>             {
>           Geth1_EsumAt(0)->Fill(0.00009118*sum);
>
>           Geth1_EsumAt(0)->SetLineColor(3);
>
>              }
>
>           Geth1_EsumAt(0)->Draw();
>
>           if(icalo==2)
>             {
>           Geth1_EsumAt(1)->Fill(0.00009118*sum);
>
>             }
>
>           Geth1_EsumAt(1)->Draw("same");
>
> And attached is the screen shot from ARGUS.
>
> Now the problem is: when I add the Draw() and Draw("same") codes in the src/task
> code, it always creates two copies of the same pad. The 0th pad and the very last
> pad. So what ever is on the last pad in the attachment is being replaced by the
> same copy of the 0th pad. I kept chaning the Index number in histoGUI.xml, but what
> ever I do, if I try to draw two histograms on the same pad and add those codes in
> the srdc/task .cpp file, it always creates two copies.
>
> I don't know where to look at to fix the problem.
>
> Is there any other way I can add multiple histograms on a pad, while keeping the
> other pads on the canvas intact?
>
> Any help on this issue will be much appreciated. |
|
23 Oct 2015, Joe Grange, Forum, Running ROME in online mode
|
Hi folks,

I've been a happy and successful user of rome in the offline mode for some time,
and now when I try and connect it to a current run the analyzer does not find
the current file.  I attach a screenshot - you can see when I run the analyzer
instead of reporting a successful connection to a midas file it says it starts Run
#-1.  I use a file path specified in romeConfig.xml which is successful when I run
in offline mode but not in online mode, even when I specify the file path with the
run-time argument -pi.  Any ideas what may be the trouble?

I did verify that my romeConfig.xml file specifies the online mode run configuration.

Thanks very much,
Joe |
|
29 Oct 2015, Ryu Sawada, Forum, Running ROME in online mode
|
Dear Joe

In the online mode, the analyzer does not read midas files.
Instead, it connects to a midas experiment over the network or to the local shared memory.

Same as other midas online applications, you may need to specify the hostname of the midas system and the
experiment name.
You can set the parameters in the <Online> section of your configuration XML file.

Of course, the midas system has to be ready to accept the connection.
You can check it, for example, using 'odbedit' command.

Best regards,

Ryu

> Hi folks,
>
> I've been a happy and successful user of rome in the offline mode for some time,
> and now when I try and connect it to a current run the analyzer does not find
> the current file.  I attach a screenshot - you can see when I run the analyzer
> instead of reporting a successful connection to a midas file it says it starts Run
> #-1.  I use a file path specified in romeConfig.xml which is successful when I run
> in offline mode but not in online mode, even when I specify the file path with the
> run-time argument -pi.  Any ideas what may be the trouble?
>
> I did verify that my romeConfig.xml file specifies the online mode run configuration.
>
> Thanks very much,
> Joe |
|
05 Nov 2015, Joe Grange, Forum, Running ROME in online mode
|
Dear Ryu,

Thanks for your response.  Unfortunately setting these parameters in the XML file does not change the apparent
behavior and I still cannot connect to the experiment in online mode.  I also notice that other colleagues
working with independent experiments successfully run ROME in the online mode without setting the parameters
in the <online> section of the XML file.

Can you tell me how I can verify the system is ready to accept the connection with the odbedit command?  I can
verify all basic information such as experiment name, run number, are as expected but I wonder if you mean
something more specific.

Thank you,
Joe |
|
08 Nov 2015, Ryu Sawada, Forum, Running ROME in online mode
|
Dear Joe,
Did you run ROMEBuilder for your application with -midas option ?
With this option, MIDAS library is linked to the application for communicating with MIDAS experiments.
Actual connection is done with using a function implemented in the MIDAS library.
This is the code where a ROME application connects to MIDAS.
(You can see this in $ROMESYS/src/ROMEMidasDAQ.cpp)
cm_connect_experiment is implemented in $MIDASSYS/src/midas.c
//______________________________________________________________________________
Bool_t ROMEMidasDAQ::ConnectExperiment(ROMEMidasDAQ *localThis)
{
   // Connect to the experiment
#if defined( HAVE_MIDAS )
   if (cm_connect_experiment(const_cast<char*>(gROME->GetOnlineHost()),
                             const_cast<char*>(gROME->GetOnlineExperiment()),
                             const_cast<char*>(gROME->GetOnlineAnalyzerName()), 0) != SUCCESS) {
      ROMEPrint::Error("\nCan not connect to experiment\n");
      return kFALSE;
   }
Can you check if this function is called by adding
cout<<"HERE"<<endl;
before the 'if' line and compile your application ?
If you didn't use -midas option when you run ROMEBuilder, HAVE_MIDAS will not be defined and cm_connect_experiment will not be called.
When nothing is written in <online> section of XML, I think the application tries to connect to the localhost with the experiment name defined in /etc/exptab.
I didn't mean anything specific about odbedit.
I guess if you can connect the MIDAS system with odbedit, then the system is ready to accept analyzer too.
But you could ask also MIDAS experts about this issue.
Ryu
> Dear Ryu,
>
> Thanks for your response. Unfortunately setting these parameters in the XML file does not change the apparent
> behavior and I still cannot connect to the experiment in online mode. I also notice that other colleagues
> working with independent experiments successfully run ROME in the online mode without setting the parameters
> in the <online> section of the XML file.
>
> Can you tell me how I can verify the system is ready to accept the connection with the odbedit command? I can
> verify all basic information such as experiment name, run number, are as expected but I wonder if you mean
> something more specific.
>
> Thank you,
> Joe |
|
16 Nov 2015, Joe Grange, Forum, Running ROME in online mode
|
Dear Ryu,
Thanks very much, indeed it was user error and I did not set -midas option at the compilation stage.
Joe
| Ryu Sawada wrote: | Dear Joe,
Did you run ROMEBuilder for your application with -midas option ?
With this option, MIDAS library is linked to the application for communicating with MIDAS experiments.
Actual connection is done with using a function implemented in the MIDAS library.
This is the code where a ROME application connects to MIDAS.
(You can see this in $ROMESYS/src/ROMEMidasDAQ.cpp)
cm_connect_experiment is implemented in $MIDASSYS/src/midas.c
//______________________________________________________________________________
Bool_t ROMEMidasDAQ::ConnectExperiment(ROMEMidasDAQ *localThis)
{
   // Connect to the experiment
#if defined( HAVE_MIDAS )
   if (cm_connect_experiment(const_cast<char*>(gROME->GetOnlineHost()),
                             const_cast<char*>(gROME->GetOnlineExperiment()),
                             const_cast<char*>(gROME->GetOnlineAnalyzerName()), 0) != SUCCESS) {
      ROMEPrint::Error("\nCan not connect to experiment\n");
      return kFALSE;
   }
Can you check if this function is called by adding
cout<<"HERE"<<endl;
before the 'if' line and compile your application ?
If you didn't use -midas option when you run ROMEBuilder, HAVE_MIDAS will not be defined and cm_connect_experiment will not be called.
When nothing is written in <online> section of XML, I think the application tries to connect to the localhost with the experiment name defined in /etc/exptab.
I didn't mean anything specific about odbedit.
I guess if you can connect the MIDAS system with odbedit, then the system is ready to accept analyzer too.
But you could ask also MIDAS experts about this issue.
Ryu
> Dear Ryu,
>
> Thanks for your response. Unfortunately setting these parameters in the XML file does not change the apparent
> behavior and I still cannot connect to the experiment in online mode. I also notice that other colleagues
> working with independent experiments successfully run ROME in the online mode without setting the parameters
> in the <online> section of the XML file.
>
> Can you tell me how I can verify the system is ready to accept the connection with the odbedit command? I can
> verify all basic information such as experiment name, run number, are as expected but I wonder if you mean
> something more specific.
>
> Thank you,
> Joe |
|
|
24 Oct 2015, Robert Pattie, Forum, ROME / Argus crashing between runs with MIDAS
|
I'm running ROME+Argus as an online analyzer and display for a MIDAS DAQ system.
 In our set up there is generally a few seconds between MIDAS runs.  ROME
handles the first run just fine, but always crashes when runs are taken in quick
succession like this.  When running in a slower mode, letting ROME finish
whatever run of end task exist, the online analyzer does not have this problem.
 I've suppressed writing all output files while in the online mode and I don't
have any end of run operations in any of the tasks.  What is happening at the
end of running that is causing ROME to crash?

Thanks for any help. |
|
26 Oct 2015, Konstantin Olchanski, Forum, ROME / Argus crashing between runs with MIDAS
|
> I'm running ROME+Argus as an online analyzer and display for a MIDAS DAQ system.
>  In our set up there is generally a few seconds between MIDAS runs.  ROME
> handles the first run just fine, but always crashes when runs are taken in quick
> succession like this.  When running in a slower mode, letting ROME finish
> whatever run of end task exist, the online analyzer does not have this problem.
>  I've suppressed writing all output files while in the online mode and I don't
> have any end of run operations in any of the tasks.  What is happening at the
> end of running that is causing ROME to crash?
>
> Thanks for any help.

You have to provide a stack trace from your crash. RTFM the gdb command "where".

K.O. |
|
29 Oct 2015, Ryu Sawada, Forum, ROME / Argus crashing between runs with MIDAS
|
Hello,

You can try to set <MidasOnlineCommunicationThread>to be true in your config XML file.
By doing it, the communication with the midas system will be done in a dedicated thread so it runs independently
of analysis tasks.

Ryu

> I'm running ROME+Argus as an online analyzer and display for a MIDAS DAQ system.
>  In our set up there is generally a few seconds between MIDAS runs.  ROME
> handles the first run just fine, but always crashes when runs are taken in quick
> succession like this.  When running in a slower mode, letting ROME finish
> whatever run of end task exist, the online analyzer does not have this problem.
>  I've suppressed writing all output files while in the online mode and I don't
> have any end of run operations in any of the tasks.  What is happening at the
> end of running that is causing ROME to crash?
>
> Thanks for any help. |
|